Published
25 mins ago
on
July 12, 2024
| 19 views
-->
By
Julia Wendling
Article & Editing
- Selin Oğuz
- Ryan Bellefontaine
Graphics & Design
- Alejandra Dander
The following content is sponsored by BHP
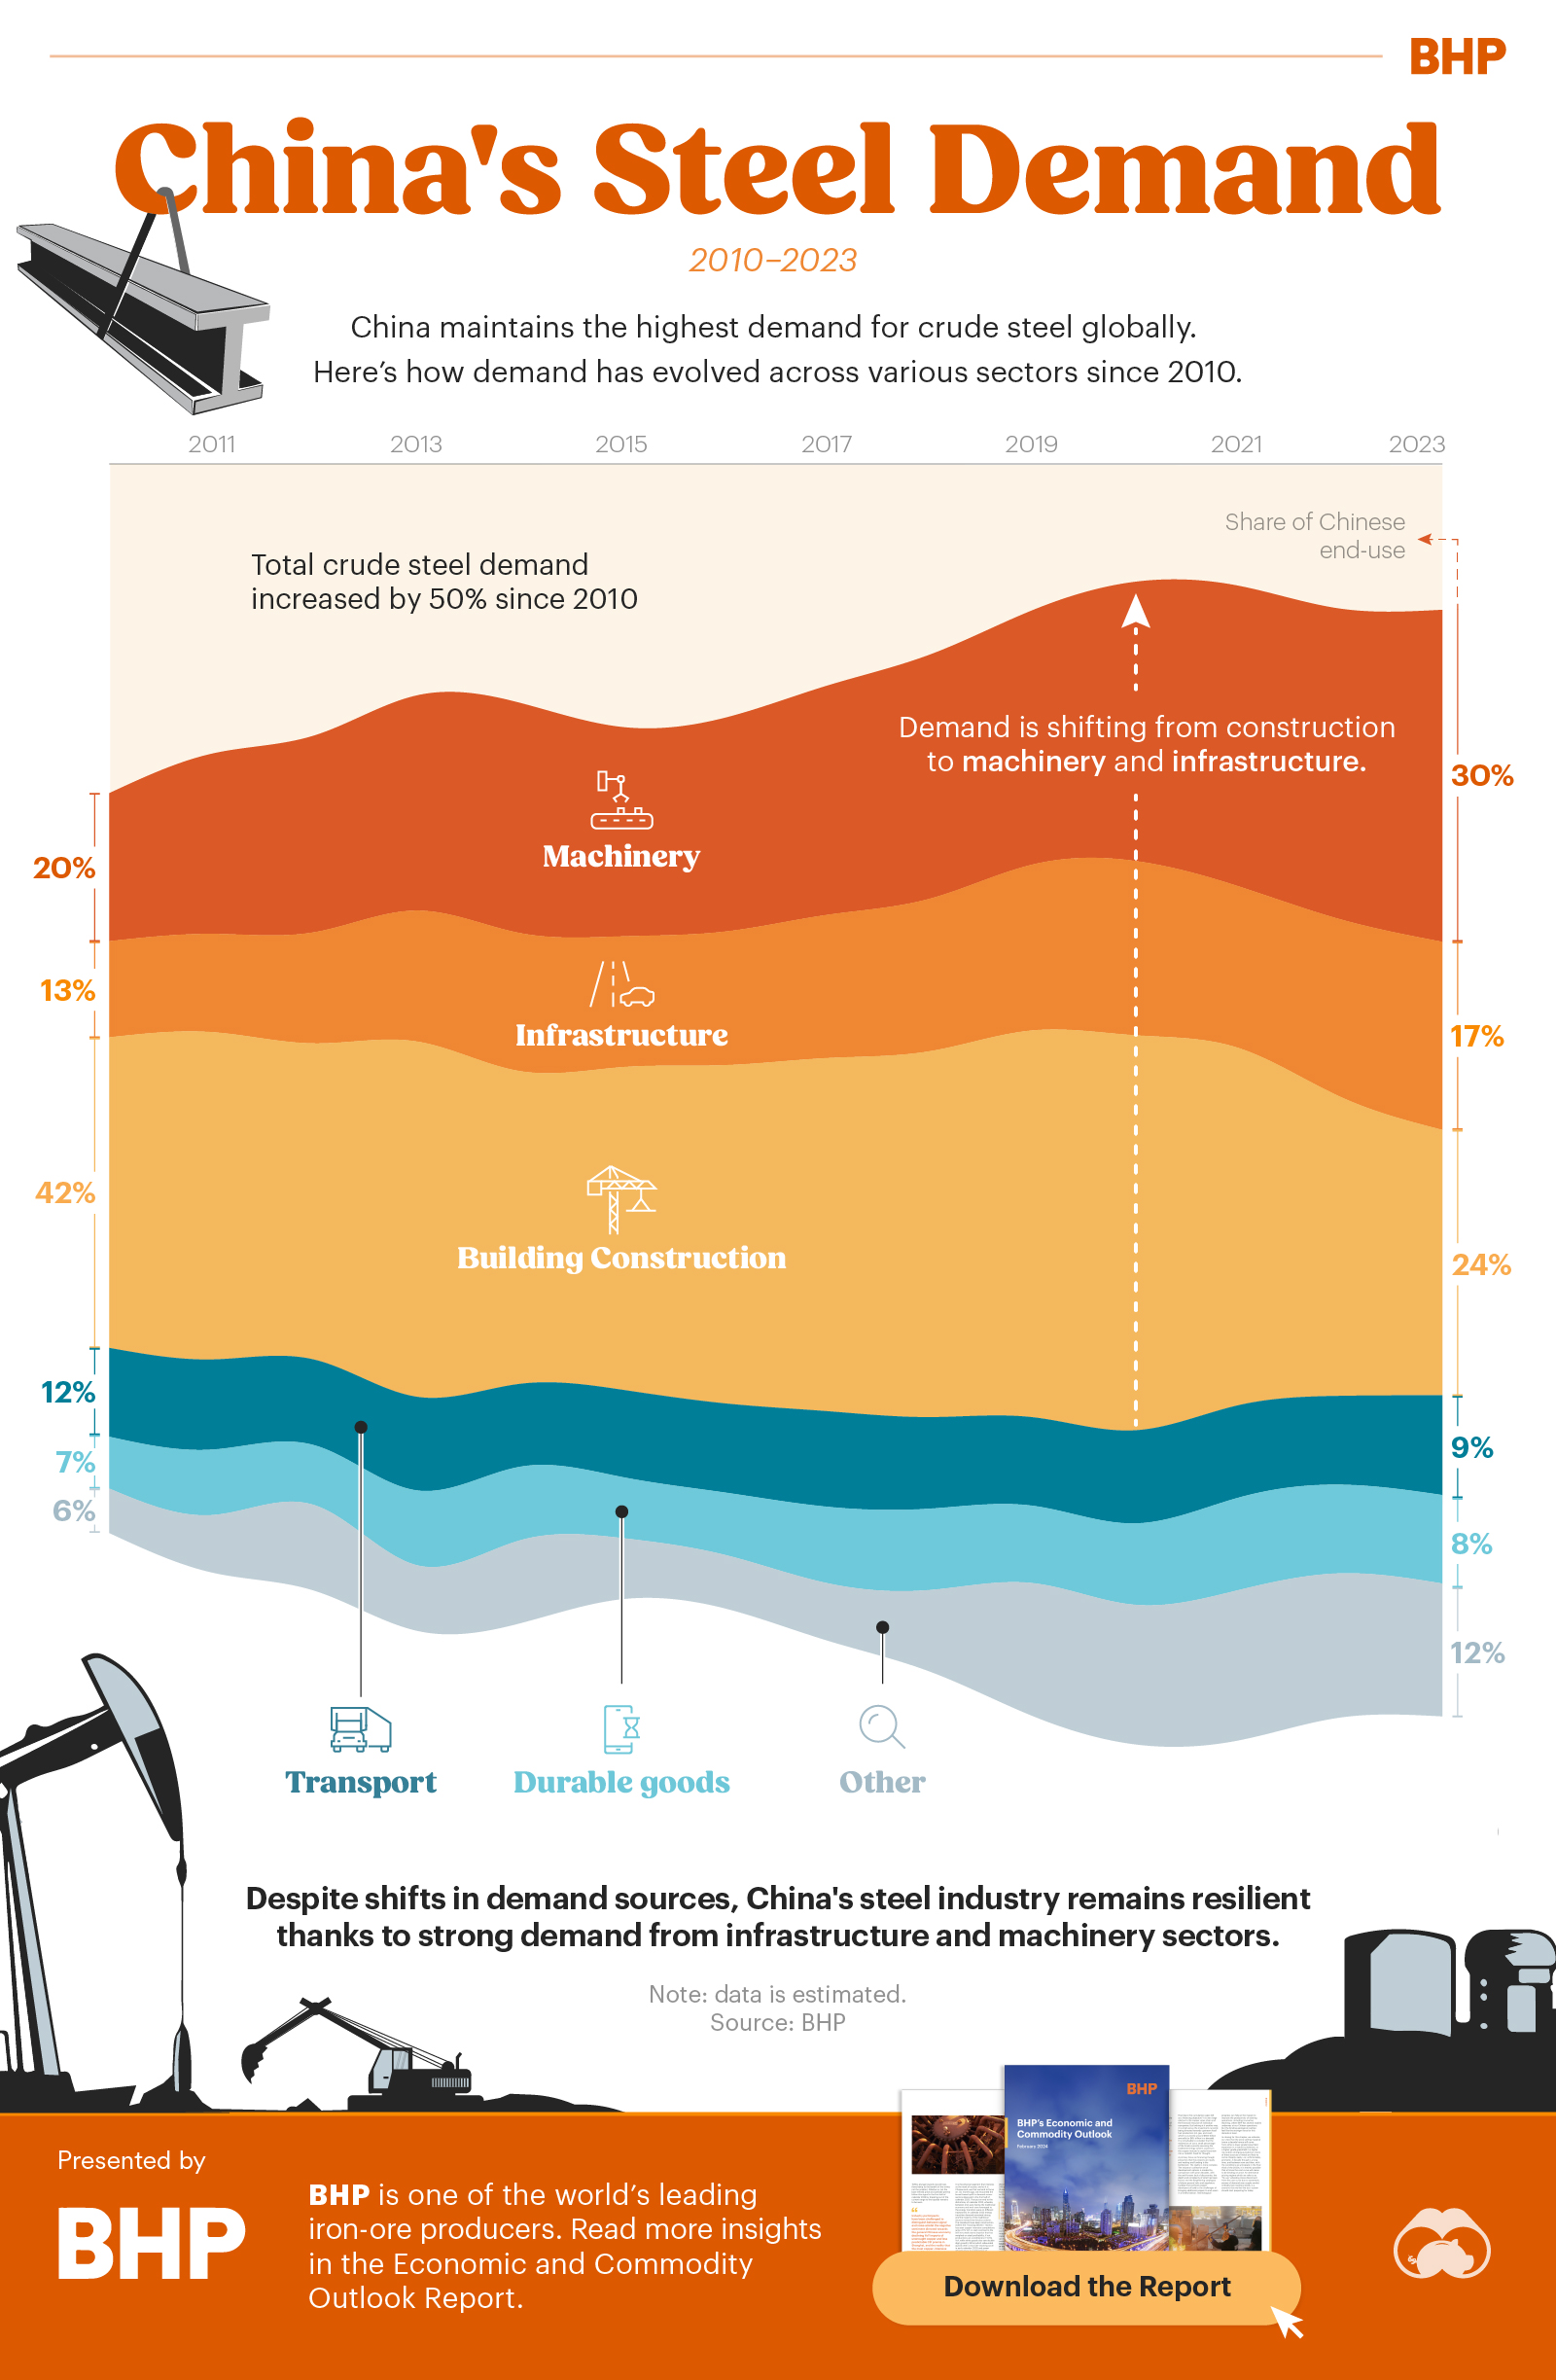
Visualized: China’s Steel Demand Through Time
As the world’s manufacturing powerhouse, China has the highest global demand for crude steel, with the market experiencing remarkable growth since 2010.
In 2023, China’s crude steel demand reached 911 million metric tons. This is up an estimated 50% from 609 million metric tons 13 years earlier. When adding in exports and changes to inventory, China surpassed 1 billion metric tons of steel production for the fifth year in a row.
However, the growth in demand for the metal has not been even across industries. In this graphic, we’ve partnered with BHP to visualize how demand for steel on a sectoral level has shifted between 2010 and 2023.
The Sectors Driving Steel Demand
We observed demand for crude steel across the following sectors:
- Machinery: machinery used in power, construction, metals and mining, agriculture, tools and parts, etc.
- Infrastructure: roads, railways, subways, pipelines, etc.
- Construction: urban and rural housing, office buildings, industrial buildings, WRAC buildings (wholesale, retail, accommodation, catering), etc.
- Transport: light-duty vehicles, trucks and buses, auto parts, shipbuilding, etc.
- Consumer Durable Goods: refrigerators, washing machines, air conditioners, microwaves, etc.
- Metal Goods: containers and hardware, etc.
- Other: smaller categories, statistical change, etc.
In 2010, the largest share of Chinese demand came from the construction sector. Construction accounted for an estimated 42% of the country’s total steel needs. Machinery (20%) and infrastructure (13%) were the industries with the second- and third-highest demand, respectively.
Over the past 13 years, however, demand has shifted towards the machinery and infrastructure industries.
| Sector | 2010 (%) | 2023 (%) |
|---|---|---|
| Machinery | 20 | 30 |
| Infrastructure | 13 | 17 |
| Construction | 42 | 24 |
| Transport | 12 | 9 |
| Durable Goods | 7 | 8 |
| Other | 6 | 12 |
The demand for steel from the construction industry is estimated to have dropped from 42% of total demand to 24%, as construction firms purchased 37 million metric tons less steel in 2023 compared to 2010. This slump can, in part, be attributed to the Chinese real estate crisis and developer bankruptcies. Both of these factors led to a slowdown in residential building starts.
The machinery sector, on the other hand, has witnessed incredible growth. It rose from an estimated 20% share of overall Chinese steel demand in 2010 to 30% by 2023, boosted by an influx of equipment renewals. Infrastructure saw approximate growth of 13% to 17% over this timeframe.
Steel Demand for Transportation and Durable Goods
The share of steel used by the transport sector was estimated to fall from 12% in 2010 to 9% in 2023. However, there was an uptick in the amount of steel used by the industry. It rose from around 73 million metric tons in 2010 to 82 million metric tons 13 years later. And, with more than half of all new electric vehicles (EVs) sold worldwide made in China, the sector could receive support if EVs continue to gain in popularity.
In fact, the green economy needs the steel industry—it remains vital for the production of emerging technologies. As such, it is important that nations take steps towards “cleaning” their steel industries. China is doing so with its focus on carbon capture, utilization, and storage technologies, employing green hydrogen metallurgy, and introducing electric furnaces.
Steel demand for durable goods rose slightly from 2010 to 2023. However, the relatively steady share masks the near-doubling of absolute steel purchased by this sector—up from 43 million metric tons to an estimated 73 million metric tons.
The Path Forward for Steel
The Chinese steel industry remains robust—growing by an estimated 50% from 2010 to 2023—despite significant shifts beneath the surface.
As the energy transition progresses, further changes in industry demand for steel are likely, especially with the increasing prominence of clean technologies, such as EVs. Conversely, demand from the construction industry remains closely tied to the outlook of the country’s housing sector.
![]()
BHP is one of the world’s leading iron ore producers. Read more insights in its economic and commodity outlook report.

Please enable JavaScript in your browser to complete this form.Enjoying the data visualization above? *Subscribe
Related Topics: #china #steel #infrastructure #construction #transport #bhp #steel demand #machinery #durable goods
Click for Comments
var disqus_shortname = "visualcapitalist.disqus.com";
var disqus_title = "China’s Steel Demand Through Time";
var disqus_url = "https://www.visualcapitalist.com/sp/bhp01-chinas-steel-demand-through-time/";
var disqus_identifier = "visualcapitalist.disqus.com-168302";
You may also like
-

population1 week ago
See China’s Population Density Visualized Using a 3D Map
1.4 billion people live in a country stretching across 3.7 million square miles. Yet 94% of China’s population lives in only one half.
-
China1 month ago
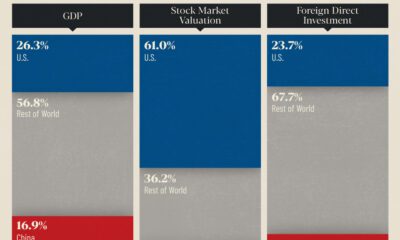
The World’s Largest Economies: Comparing the U.S. and China
How do the world’s two largest economies compare? We look at the economies of U.S. and China across GDP, stock markets, and FDI.
-

China2 months ago
Which Countries Have the Most Economic Influence in Southeast Asia?
One country dominates this survey of who has the most economic influence in the region.
-

United States2 months ago
Comparing New and Current U.S. Tariffs on Chinese Imports
The U.S. government announced a range of new tariff hikes on Chinese goods, which imports were hit the hardest?
-

United States2 months ago
Ranked: The Top 6 Economies by Share of Global GDP (1980-2024)
Gain a unique perspective on the world’s economic order from this graphic showing % share of global GDP over time.
-

China2 months ago
Charted: What Southeast Asia Thinks About China & the U.S.
A significant share of respondents from an ASEAN-focused survey are not happy about rising American and Chinese influence in the region.
Subscribe
Please enable JavaScript in your browser to complete this form.Join the 375,000+ subscribers who receive our daily email *Sign Up
The post China’s Steel Demand Through Time appeared first on Visual Capitalist.