Written By Marcus Lu
Graphics & Design
- Rosey Eason
Published April 18, 2023
•
Updated April 18, 2023
•
The following content is sponsored by The Hinrich Foundation
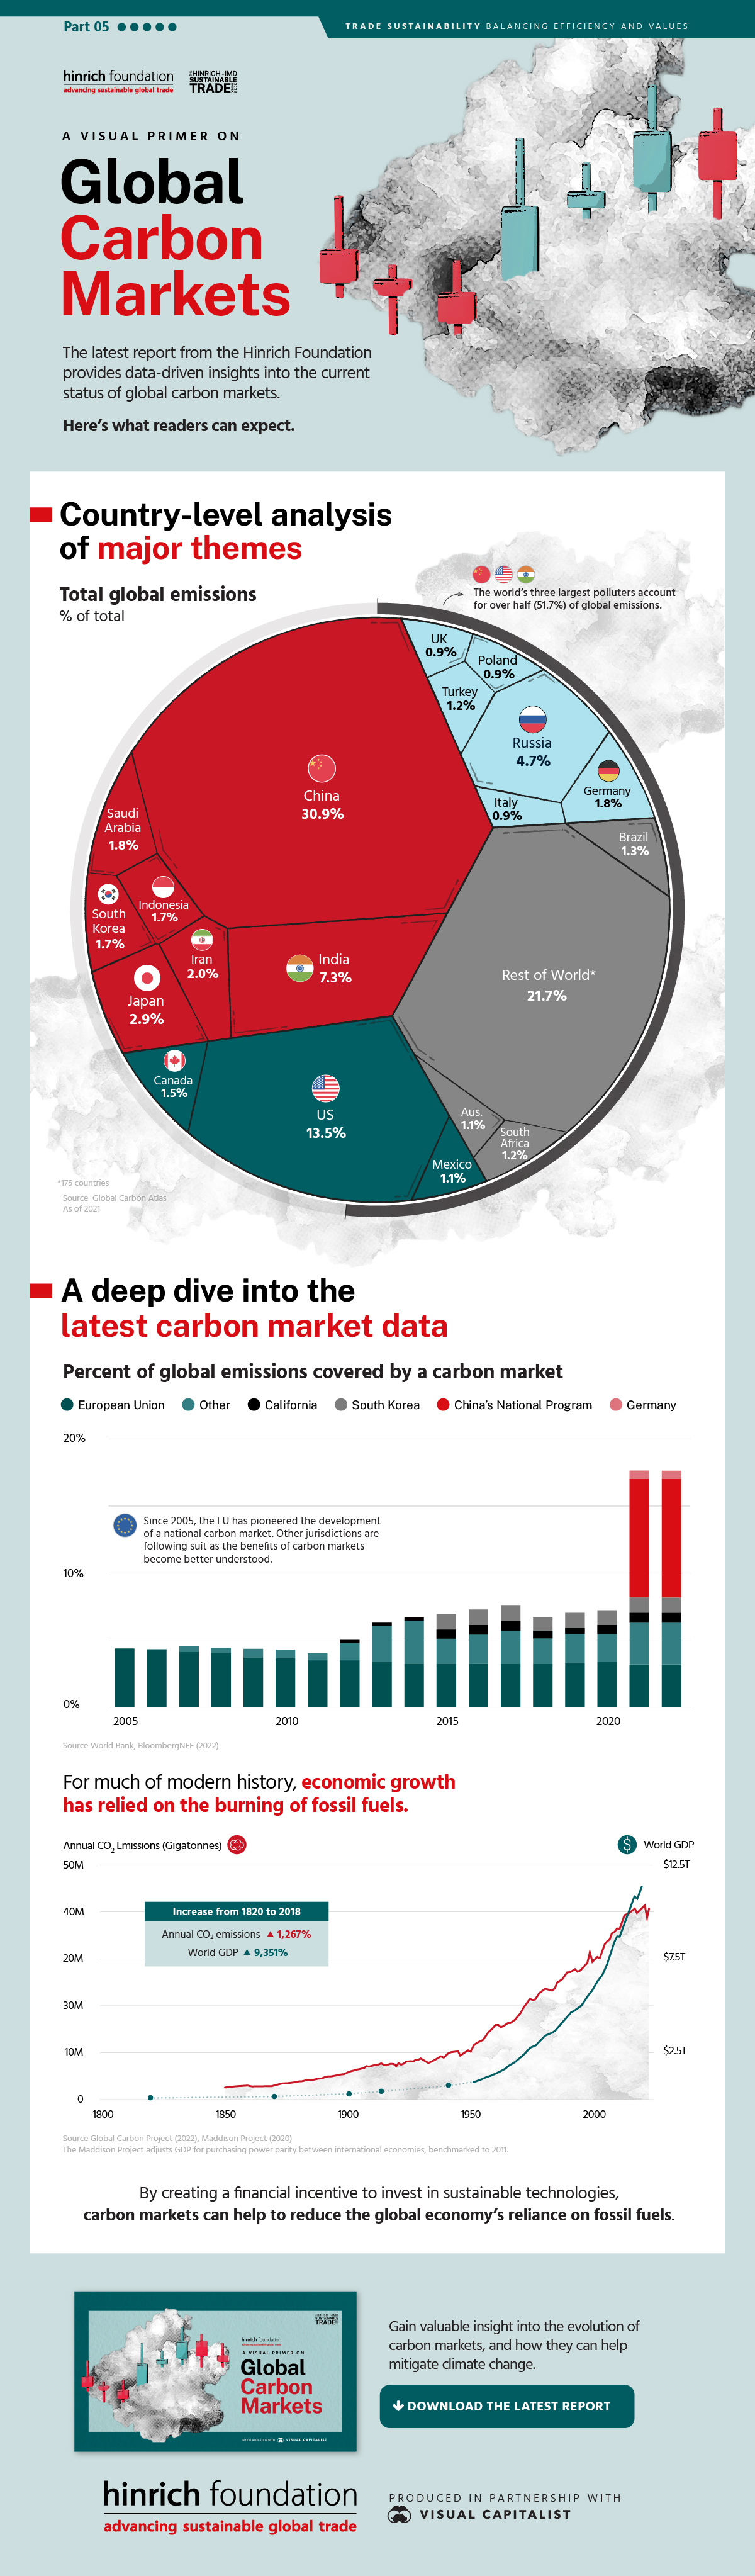
Global Carbon Markets: Highlights from the Latest Report
The Hinrich Foundation is proud to release their latest data-driven report: A Visual Primer on Global Carbon Markets.
This report was produced in partnership with Visual Capitalist, and provides insights into how carbon markets work, how they’re evolving, and where they’re being effectively implemented.
Why Carbon Markets?
Climate change is viewed as one of the greatest challenges facing the world today. In response, nearly every country in the world has set a goal to reach net zero by 2050.
To do this, countries will need to find ways to reduce their reliance on fossil fuels. One solution is carbon markets, which give businesses and individuals a place to buy and sell carbon credits. Carbon credits are tradeable permits that give their holder the right to emit a set amount of CO2.
When combined with government-imposed limits on pollution, carbon credits create an economic incentive for businesses to reduce their emissions.
For example, a company that pollutes beyond local limits has two options. It can either mitigate its emissions by investing in cleaner technologies, or purchase carbon credits to stay within compliance. In the mean time, the proceeds from these credits may fund other emissions-reducing projects, such as a wind or solar farm.
Data Preview
This infographic provides a small preview of the data visualizations featured in the full report.
We begin by breaking down global emissions by country. A key finding is that the world’s three largest polluters account for more than half (51.7%) of total emissions.
| Country | Emissions (MtCO2) | Percentage of Total |
|---|---|---|
| China | 11,472 | 30.9% |
| U.S. | 5,007 | 13.5% |
| India | 2,710 | 7.3% |
| Russia | 1,756 | 4.7% |
| Japan | 1,067 | 2.9% |
| Iran | 749 | 2.0% |
| Germany | 675 | 1.8% |
| Saudi Arabia | 672 | 1.8% |
| Indonesia | 619 | 1.7% |
| South Korea | 616 | 1.7% |
| Canada | 546 | 1.5% |
| Brazil | 489 | 1.3% |
| Turkey | 446 | 1.2% |
| South Africa | 436 | 1.2% |
| Mexico | 407 | 1.1% |
| Australia | 391 | 1.1% |
| UK | 347 | 0.9% |
| Italy | 329 | 0.9% |
| Poland | 329 | 0.9% |
| Rest of World | 8,061 | 21.7% |
Source: Global Carbon Atlas. As of 2021
This data gives us an idea of where carbon markets could have the greatest potential. As shown in the second chart of this infographic, national carbon markets cover less than 20% of global emissions.
Download the Free Report
A Visual Primer on Global Carbon Markets is a free report from the Hinrich Foundation, produced in partnership with Visual Capitalist. Readers will gain valuable insights into the evolution of carbon markets, and how they can help mitigate climate change.
This report is part of the Hinrich-IMD Sustainable Trade Index 2022 body of research.

Please enable JavaScript in your browser to complete this form.Subscribe to our free newsletter and get your mind blown on a daily basis: *Sign up
Related Topics: #co2 #climate change #pollution #carbon emissions #carbon markets #Hinrich Foundation
Click for Comments
var disqus_shortname = "visualcapitalist.disqus.com";
var disqus_title = "Global Carbon Markets: Highlights from the Latest Report";
var disqus_url = "https://www.visualcapitalist.com/sp/global-carbon-markets-highlights-from-the-latest-report/";
var disqus_identifier = "visualcapitalist.disqus.com-157184";
You may also like
-
Datastream3 days ago
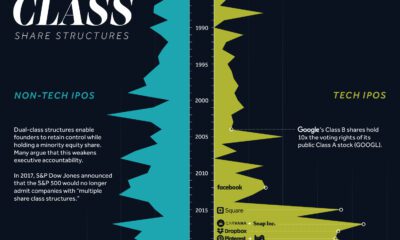
More U.S. Tech Companies are Adopting Unequal Dual-Class Voting Structures
Dual-class share structures are rising in popularity, and they give executives much more voting power within a public company.
-

Green5 days ago
Mapped: Air Pollution Levels Around the World in 2022
Exploring 2022 average air pollution levels around the world by PM2.5 concentration.
-

VC+6 days ago
Bonus Gift: Celebrating the Best of the VC+ Archive
To celebrate the launch of our VC+ archive, we’re offering a bonus gift with the best visual insights. See what else VC+ members receive in April!
-
Markets6 days ago
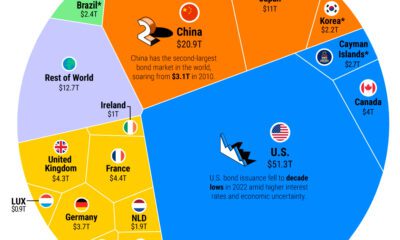
Ranked: The Largest Bond Markets in the World
The global bond market stands at $133 trillion in value. Here are the major players in bond markets worldwide.
-
population1 week ago
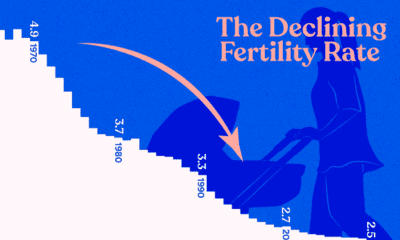
Visualizing the World’s Plummeting Fertility Rate
In this graphic we explore the world’s declining fertility rate over the last 60 years and the disparity in fertility rates between nations
-

Misc1 week ago
Have Combustion Vehicle Sales Already Peaked?
With EVs becoming more popular around the world, have combustion vehicles reached a peak? Find out in this infographic.
Subscribe
Please enable JavaScript in your browser to complete this form.Join the 380,000+ subscribers who receive our daily email *Sign Up
The post Global Carbon Markets: Highlights from the Latest Report appeared first on Visual Capitalist.