![]()
See this visualization first on the Voronoi app.
Use This Visualization
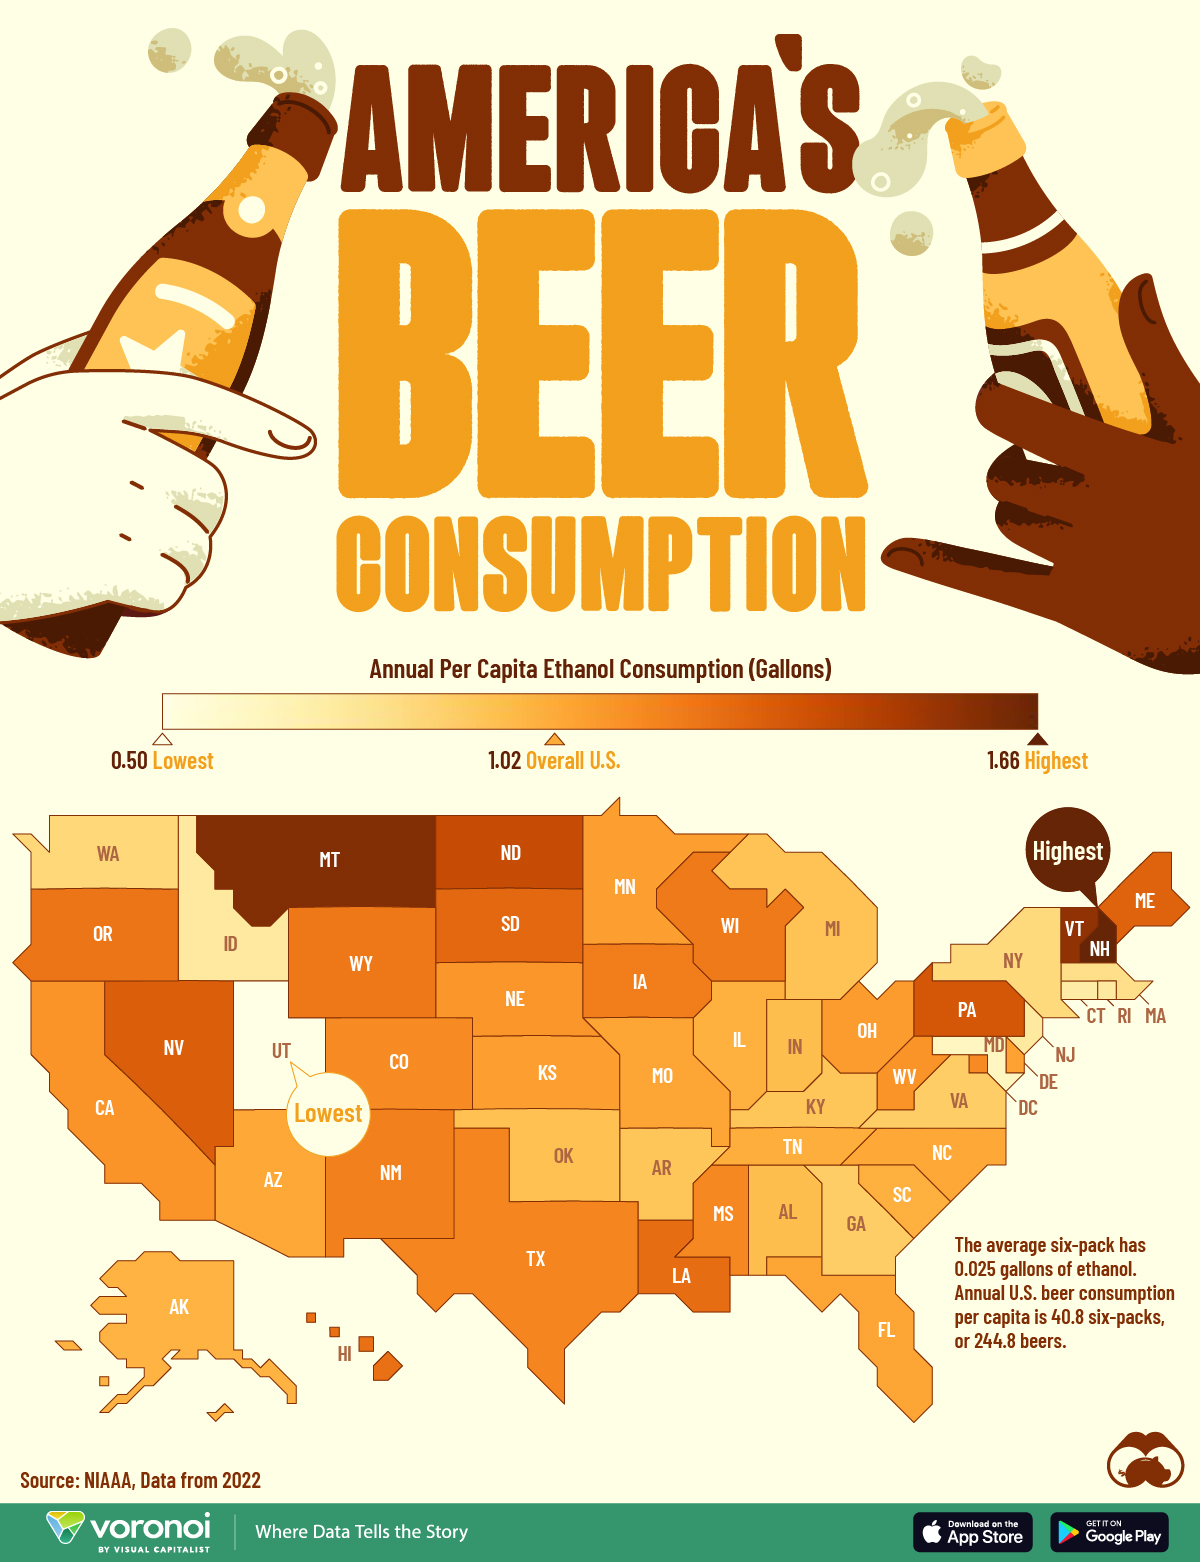
Beer Consumption Per Capita by U.S. State
This was originally posted on our Voronoi app. Download the app for free on iOS or Android and discover incredible data-driven charts from a variety of trusted sources.
From backyard barbecues to Sunday night football, beer is deeply woven in the fabric of American culture. It’s the choice alcoholic beverage for North and South Americans, according to WHO data.
This map visualizes the annual per capita ethanol consumption of beer in gallons in 2022 by U.S. state. The data comes from the National Institute on Alcohol Abuse and Alcoholism (NIAAA), which measures alcohol consumption in ethanol volume.
For reference, the average six-pack of beer has 0.025 gallons of ethanol.
Consumption figures only include residents age 14 or older, and is based on alcoholic beverage sales data collected by the Alcohol Epidemiologic Data System (AEDS), the National Alcohol Beverage Control Association, and from various reports produced by beverage industry sources.
Which States Consume The Most Beer?
Below, we show each state’s annual per capita ethanol consumption of beer in gallons in 2022.
| Rank | State | Per capita ethanol consumption in gallons of beer |
|---|---|---|
| 1 | New Hampshire | 1.66 |
| 2 | Montana | 1.58 |
| 3 | Vermont | 1.54 |
| 4 | North Dakota | 1.38 |
| 5 | Pennsylvania | 1.33 |
| 6 | Nevada | 1.30 |
| 7 | Maine | 1.28 |
| 8 | South Dakota | 1.26 |
| 9 | Louisiana | 1.24 |
| 10 | Hawaii | 1.23 |
| 11 | Oregon | 1.21 |
| 12 | Wyoming | 1.2.0 |
| 13 | Wisconsin | 1.19 |
| 14 | Iowa | 1.18 |
| 15 | New Mexico | 1.17 |
| 16 | Texas | 1.15 |
| 17 | Mississippi | 1.14 |
| 18 | Colorado | 1.13 |
| 19 | District of Columbia | 1.13 |
| 20 | California | 1.10 |
| 21 | West Virginia | 1.10 |
| 22 | Nebraska | 1.09 |
| 23 | Ohio | 1.07 |
| 24 | Kansas | 1.06 |
| 25 | Minnesota | 1.06 |
| 26 | Delaware | 1.05 |
| 27 | Florida | 1.04 |
| 28 | Missouri | 1.04 |
| 29 | Arizona | 1.03 |
| 30 | North Carolina | 1.03 |
| 31 | Tennessee | 1.01 |
| 32 | Illinois | 1.00 |
| 33 | South Carolina | 1.00 |
| 34 | Alaska | 0.99 |
| 35 | Alabama | 0.95 |
| 36 | Indiana | 0.95 |
| 37 | Oklahoma | 0.94 |
| 38 | Michigan | 0.93 |
| 39 | Arkansas | 0.92 |
| 40 | Kentucky | 0.92 |
| 41 | Georgia | 0.89 |
| 42 | Virginia | 0.89 |
| 43 | Washington | 0.84 |
| 44 | New York | 0.83 |
| 45 | Massachusetts | 0.80 |
| 46 | Idaho | 0.74 |
| 47 | New Jersey | 0.74 |
| 48 | Rhode Island | 0.74 |
| 49 | Connecticut | 0.72 |
| 50 | Maryland | 0.63 |
| 51 | Utah | 0.50 |
Northeastern states, particularly New Hampshire (1.66 gallons) and Vermont (1.58 gallons) have some of the highest beer consumption rates in the country.
New Hampshire doesn’t have state sales tax, making alcohol prices considerably lower than neighboring states. This likely drives higher alcohol sales rather than necessarily higher consumption.
More than half of sales at New Hampshire liquor states come from out-of-state customers, according to the New Hampshire Liquor Commission.
Many of its state-owned liquor states are also strategically located near state borders.
When comparing global per capita consumption, European countries far outdrink the U.S. when it comes to beer.
As a whole, the beer industry in America is experiencing a decline. U.S. beer shipments reached their lowest level in 25 years, according to data from the Beer Marketer’s Insights.
The small and independent brewers’ industry in the U.S. is also experiencing a decline, with overall beer production and imports down 5% in 2023, and craft brewer sales down 1%, according to the Brewers Association.
Learn More on the Voronoi App
To learn more about beer consumption worldwide, check out this graphic that shows which countries drink the most beer according to Kirin Holdings.
The post Mapped: America’s Beer Consumption By State appeared first on Visual Capitalist.