![]()
See this visualization first on the Voronoi app.
Use This Visualization
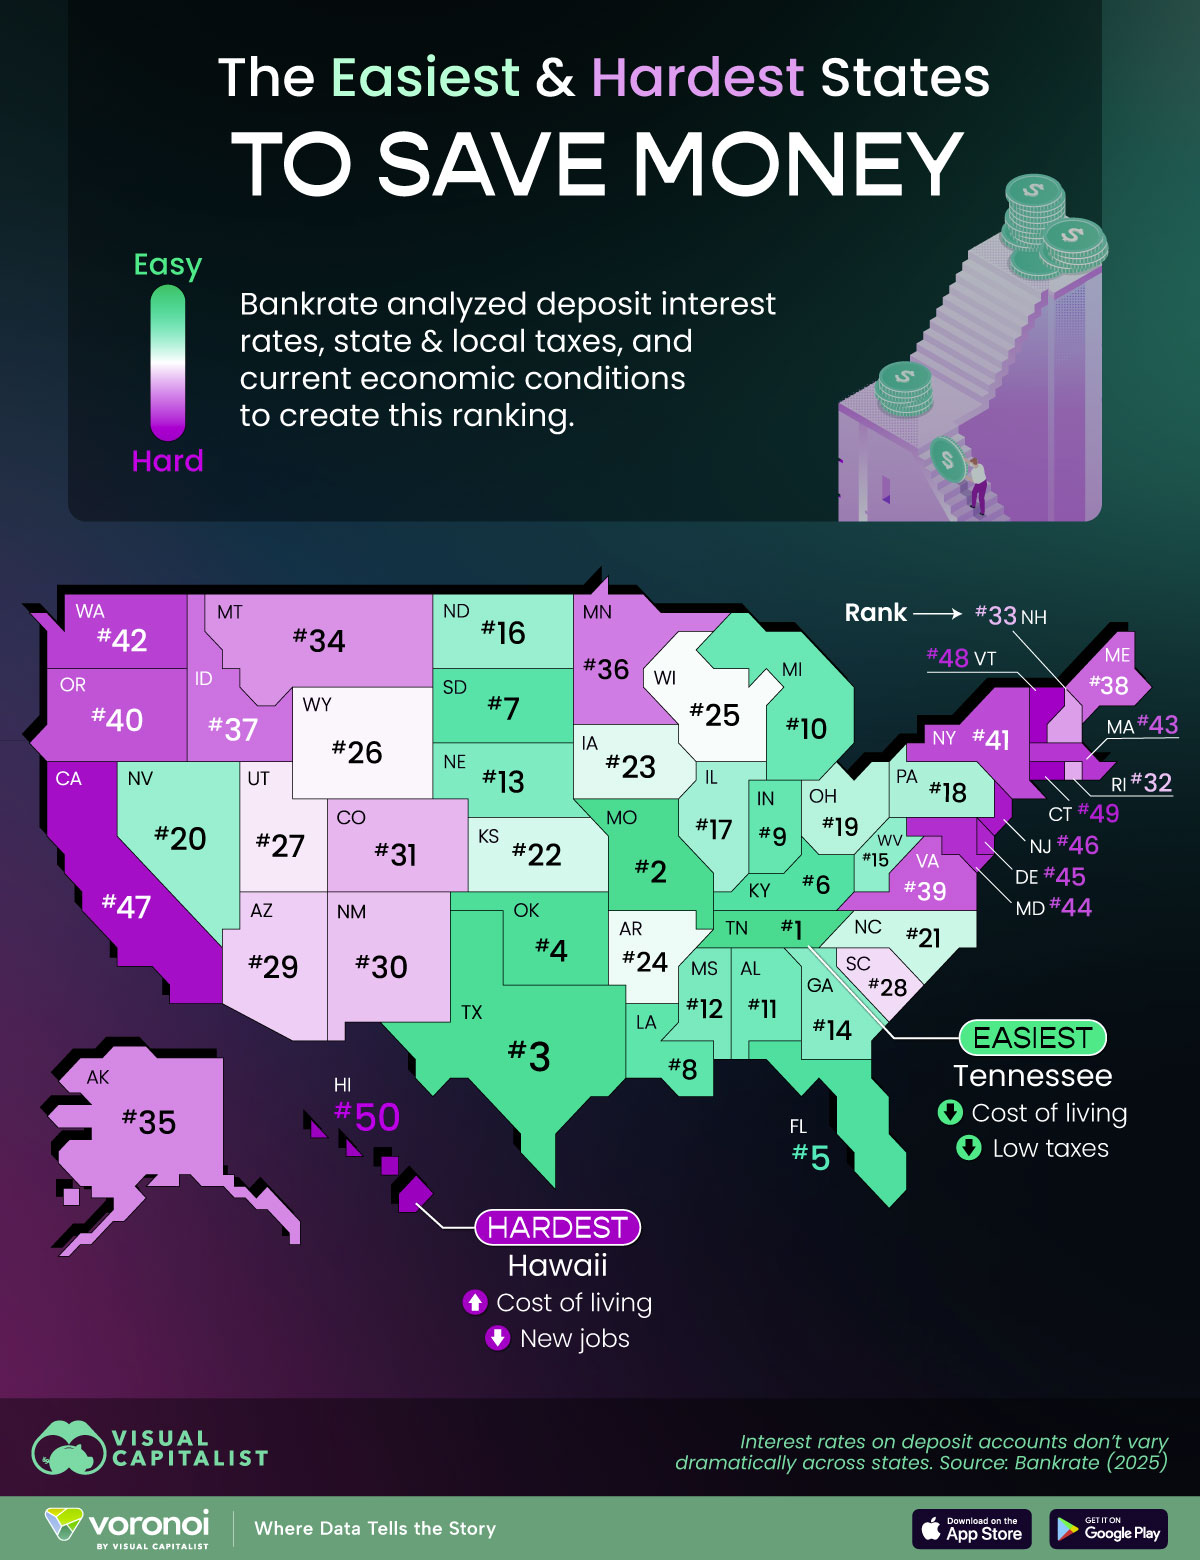
Mapped: Best and Worst U.S. States for Saving Money in 2025
This was originally posted on our Voronoi app. Download the app for free on iOS or Android and discover incredible data-driven charts from a variety of trusted sources.
Key Takeaways
- Tennessee is the easiest state for saving money, helped by its low cost of living and lack of income tax.
- Hawaii ranks last, due to high living costs and declining employment growth.
Nearly four straight years of rising inflation followed by worries of a looming recession has Americans scrambling to save to get them through tough times.
But where is saving money easiest and hardest in the U.S.?
To answer that, personal finance advisers Bankrate analyzed and ranked all 50 states on three main indicators. They are: bank deposit interest rates, state and local taxes, and the performance of the economy.
The local economy indicator includes metrics like employment growth rates, household debt-to-income ratios, and inflation-adjusted changes in household income.
For a full breakdown visit the source’s methodology page.
Ranking States by the Ability to Save Money
Bankrate’s analysis ranks Tennessee as the easiest state to save in, helped by its low cost of living and lack of income tax.
| Overall Rank | State | Local Economy Rank (50% Weight) |
State & Local Taxes (25% Weight) |
CD & MMA Interest Rates Rank (25% Weight) |
|---|---|---|---|---|
| 1 | Tennessee | 10 | 3 | 14 |
| 2 | Missouri | 8 | 13 | 6 |
| 3 | Texas | 2 | 5 | 28 |
| 4 | Oklahoma | 12 | 10 | 13 |
| 5 | Florida | 21 | 11 | 5 |
| 6 | Kentucky | 5 | 16 | 16 |
| 7 | South Dakota | 1 | 4 | 41 |
| 8 | Louisiana | 37 | 11 | 2 |
| 9 | Indiana | 9 | 13 | 24 |
| 10 | Michigan | 28 | 5 | 15 |
| 11 | Alabama | 6 | 20 | 25 |
| 12 | Mississippi | 24 | 20 | 8 |
| 13 | Nebraska | 4 | 37 | 9 |
| 14 | Georgia | 14 | 8 | 31 |
| 15 | West Virginia | 19 | 20 | 17 |
| 16 | North Dakota | 7 | 7 | 39 |
| 17 | Illinois | 20 | 44 | 1 |
| 18 | Pennsylvania | 23 | 28 | 10 |
| 19 | Ohio | 18 | 24 | 30 |
| 20 | Nevada | 29 | 16 | 26 |
| 21 | North Carolina | 13 | 23 | 33 |
| 22 | Kansas | 15 | 33 | 23 |
| 23 | Iowa | 17 | 33 | 27 |
| 24 | Arkansas | 3 | 25 | 46 |
| 25 | Wisconsin | 27 | 32 | 18 |
| 26 | Wyoming | 42 | 2 | 34 |
| 27 | Utah | 25 | 39 | 12 |
| 28 | South Carolina | 31 | 8 | 40 |
| 29 | Arizona | 34 | 15 | 35 |
| 30 | New Mexico | 26 | 25 | 43 |
| 31 | Colorado | 38 | 19 | 32 |
| 32 | Rhode Island | 45 | 36 | 4 |
| 33 | New Hampshire | 35 | 16 | 38 |
| 34 | Montana | 16 | 27 | 47 |
| 35 | Alaska | 46 | 1 | 49 |
| 36 | Minnesota | 33 | 39 | 22 |
| 37 | Idaho | 30 | 29 | 36 |
| 38 | Maine | 36 | 41 | 19 |
| 39 | Virginia | 41 | 43 | 11 |
| 40 | Oregon | 32 | 31 | 42 |
| 41 | New York | 11 | 50 | 21 |
| 42 | Washington | 40 | 29 | 44 |
| 43 | Massachusetts | 47 | 37 | 20 |
| 44 | Maryland | 48 | 35 | 7 |
| 45 | Delaware | 39 | 41 | 45 |
| 46 | New Jersey | 44 | 45 | 29 |
| 47 | California | 49 | 46 | 3 |
| 48 | Vermont | 22 | 47 | 48 |
| 49 | Connecticut | 43 | 49 | 37 |
| 50 | Hawaii | 50 | 48 | 50 |
In fact the top five states all share the same characteristics: lower living costs, below-average tax burdens, and stable employment growth.
On the other hand, Hawaii ranks last due to high living costs and declining employment growth.
A glance at the states at the top and bottom of the ranking reveal geographic patterns: it’s easier to save in the South than on the coasts.
However ranked assessments can hide other patterns in state economies. For example, Southern states also have lower than average incomes, higher average debt, and a greater share of their populations below the poverty threshold.
Learn More on the Voronoi App ![]()
Saving is tough, especially when money management isn’t something that’s taught early on. Check out: Financial Literacy Levels in All 50 States to see which Americans have a head start.