Published
1 hour ago
on
May 29, 2025
| 19 views
-->
By
Ryan Bellefontaine
Graphics & Design
- Amy Realey
- Zack Aboulazm
The following content is sponsored by Tema ETFs
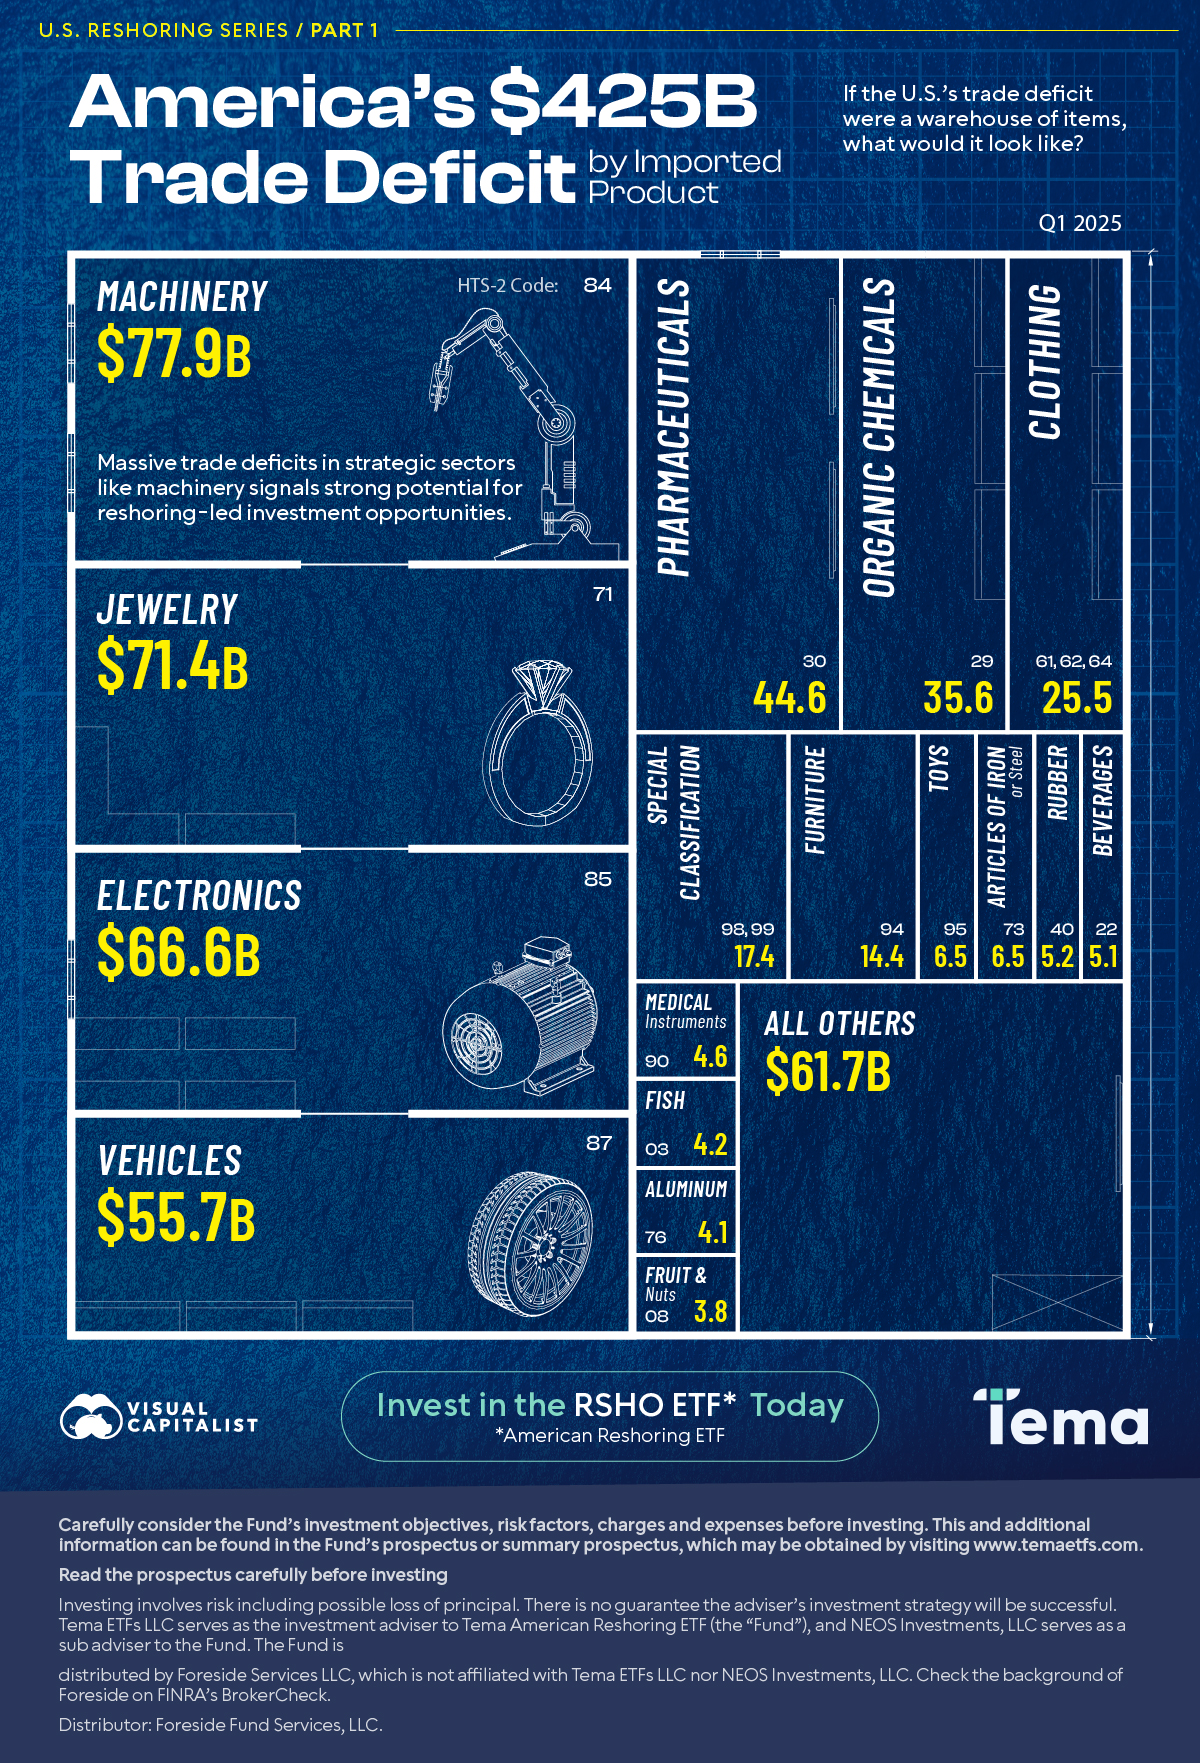
Ranked: America’s $425B Trade Deficit by Product (Q1 2025)
In the first quarter of 2025 alone, the U.S. trade deficit reached $425.5 billion. But which kinds of items make up the largest portions?
This graphic, sponsored by Tema ETFs, breaks down the deficit by product category, using data from the U.S. International Trade Commission for the first quarter of 2025.
Which Imported Items Have the Deepest Deficits?
The U.S. uses a harmonized trading system to categorize all items. The HTS-2 system has about 100 categories.
| HTS-2 Category | Import Items | Trade Deficit, Q1 2025 (USD) |
|---|---|---|
| N/A | TOTAL | $425.5B |
| 84 | Machinery | $77.9B |
| 71 | Jewelry and Precious Metals | $71.4B |
| 85 | Electronics | $66.6B |
| 87 | Vehicles | $55.7B |
| 30 | Pharmaceuticals | $44.6B |
| 29 | Organic Chemicals | $35.6B |
| 61, 62, & 64 | Clothing | $25.5B |
| 98 & 99 | Special Classifications | $17.4B |
| 94 | Furniture | $14.4B |
| 95 | Toys, Games, & Sports Equipment | $6.5B |
| 73 | Articles of Iron or Steel | $6.5B |
| 40 | Rubber | $5.2B |
| 22 | Beverages | $5.1B |
| 90 | Medical Instruments | $4.6B |
| 3 | Fish | $4.2B |
| 76 | Aluminum | $4.1B |
| 8 | Fruits & Nuts | $3.8B |
| N/A | All Others | $61.7B |
The category that holds the greatest deficit for the U.S. is category 84. This category includes machinery and mechanical appliances and had a $77.9 billion deficit in the first quarter of 2025.
Following closely is category 71, jewelry and precious metals, with a deficit of $71.4 billion. Electronics comes next at $66.6B, then vehicles at $55.7 billion. These high-value, strategic sectors comprise about 64% of the total deficit.
Other top deficit categories include pharmaceuticals, apparel, and chemicals, which add tens of billions of dollars to the topline figure.
Unlike agricultural items not often cultivated in the U.S., such as coffee beans, nearly all the top categories involve items with the potential for their manufacturing to be reshored to the U.S.
The Investment Opportunity
These gaps aren’t just economic vulnerabilities—they represent opportunities.
The recent momentum behind U.S. reshoring is partly driven by sharply rising tariffs under the Trump administration, which have pushed average import duties up severalfold compared to the previous year. Re-shoring is one of the justifications for the policy shift.
As the U.S. looks to reclaim production in areas where it imports the most, select sectors could experience rapid domestic investment and growth.
The Tema American Reshoring ETF (RSHO) invests in companies positioned to benefit from the long-term structural growth opportunities in reshoring, supply chain modernization, and U.S. reindustrialization.
Disclosure
Carefully consider the Fund’s investment objectives, risk factors, charges and expenses before investing. This and additional information can be found in the Fund’s prospectus or summary prospectus, which may be obtained by visiting www.temaetfs.com. Read the prospectus or summary prospectus carefully before investing.
Investing involves risk including possible loss of principal. There is no guarantee the adviser’s investment strategy will be successful.
Tema ETFs LLC serves as the investment adviser to Tema American Reshoring ETF (the “Fund”), and NEOS Investments, LLC serves as a sub adviser to the Fund. The Fund is distributed by Foreside Services LLC, which is not affiliated with Tema ETFs LLC nor NEOS Investments, LLC. Check the background of Foreside on FINRA’s BrokerCheck.
Distributor: Foreside Fund Services, LLC.
Related Topics: #jewelry #etf #electronics #imports #trade deficit #partner #machinery #RSHO
Click for Comments
var disqus_shortname = "visualcapitalist.disqus.com";
var disqus_title = "Ranked: America’s $425B Trade Deficit by Product";
var disqus_url = "https://www.visualcapitalist.com/sp/ranked-americas-trade-deficit-by-product-tema-02/";
var disqus_identifier = "visualcapitalist.disqus.com-178233";
More from Tema ETFs
-
Markets1 week ago
Visualized: The Rising Concentration of the S&P 500
By early 2025, the top ten companies in the S&P 500 made up nearly 40%, marking a high degree of market concentration.
-

Markets2 weeks ago
The Surging Value of the Magnificent 7 Versus the S&P 500 (2014-2024)
Subscribe
Please enable JavaScript in your browser to complete this form.Join the 375,000+ subscribers who receive our daily email *Sign Up