![]()
See this visualization first on the Voronoi app.
Mapped: How Many People Are ICE Detaining?
This was originally posted on our Voronoi app. Download the app for free on iOS or Android and discover incredible data-driven charts from a variety of trusted sources.
The U.S. Immigration and Customs Enforcement (ICE) is a federal law enforcement agency under the Homeland Security umbrella. Its duty is to enforce federal laws regarding border control, customs, trade, and immigration. However, today, ICE detentions have been at the center of a national conversation due to aggressive deportations.
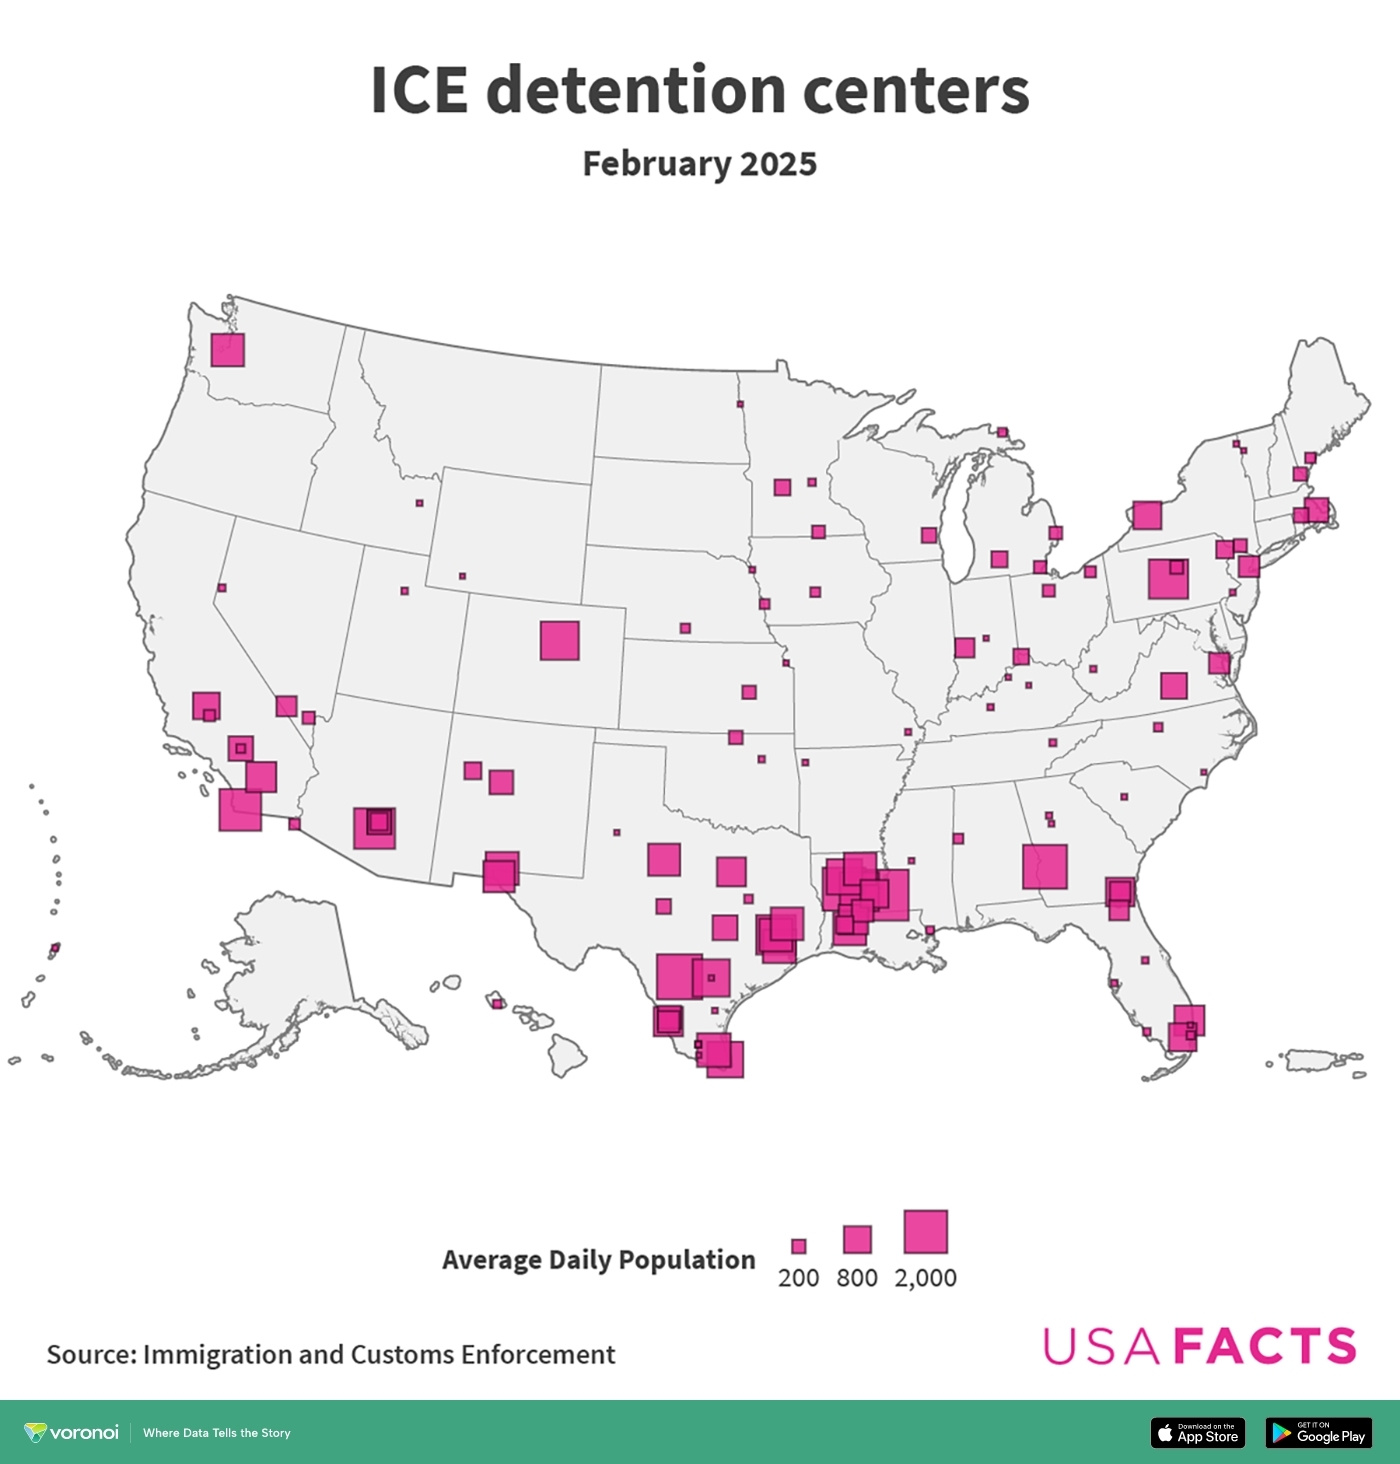
This chart, created by USAFacts, explores the average daily population of ICE detention centers in February 2025.
Who Are ICE?
ICE, established in 2002 as a Department of Homeland Security division, enforces U.S. customs and trade laws. It also manages programs to identify, arrest, and unlawfully remove people in the country.
ICE controls 122 detainee holding centers nationwide, a quarter of which are in states along the US-Mexico border.
However, the most populated centers include the Adams County Detention Center in Natchez, Mississippi (2,148 average daily detainees in February 2025); the South Texas ICE Processing Center in Pearsall, Texas (1,666); and the Stewart Detention Center in Lumpkin, Georgia (1,559).
Many ICE detentions occurred in February 2025. Below is a table showing the average daily population in ICE detention centers during that month.
| Detention Center Name | State | Average Daily Population (rounded) |
|---|---|---|
| Adams County Det Center | MS | 2148 |
| Adelanto Ice Processing Center | CA | 24 |
| Alamance County Detention Facility | NC | 20 |
| Alexandria Staging Facility | LA | 305 |
| Allen Parish Public Safety Complex | LA | 175 |
| Atlanta Us Pen | GA | 5 |
| Baker County Sheriff Dept. | FL | 242 |
| Bluebonnet Detention Facility | TX | 770 |
| Boone County Jail | KY | 133 |
| Broward County Jail | FL | 1 |
| Broward Transitional Center | FL | 656 |
| Buffalo Service Processing Center | NY | 554 |
| Calhoun County Correctional Center | MI | 139 |
| Caroline Detention Facility | VA | 273 |
| Cca, Florence Correctional Center | AZ | 376 |
| Central Louisiana Ice Processing Center (Clipc) | LA | 1182 |
| Chase County Jail | KS | 83 |
| Chippewa County Ssm | MI | 23 |
| Chittenden Regional Correctional Facility | VT | 2 |
| Cibola County Correctional Center | NM | 163 |
| Clay County Justice Center | IN | 227 |
| Clinton County Correctional Facility | PA | 78 |
| Clinton County Jail | NY | 4 |
| Coastal Bend Detention Facility | TX | 3 |
| Collier County Naples Jail Center | FL | 11 |
| Cumberland County Jail | ME | 40 |
| Dakota County Jail | NE | 3 |
| Denver Contract Detention Facility | CO | 1138 |
| Department Of Corrections Hagatna | GU | 4 |
| Desert View Annex | CA | 409 |
| Dodge County Jail | WI | 110 |
| East Hidalgo Detention Center | TX | 2 |
| Eden Detention Ctr | TX | 110 |
| El Paso Service Processing Center | TX | 720 |
| El Valle Detention Facility | TX | 854 |
| Elizabeth Contract Detention Facility | NJ | 276 |
| Eloy Federal Contract Facility | AZ | 1321 |
| Fayette County Detention Center | KY | 1 |
| Fdc Philadelphia | PA | 3 |
| Florence Service Processing Center | AZ | 376 |
| Florence Staging Facility | AZ | 173 |
| Folkston Annex Ipc | GA | 258 |
| Folkston Main Ipc | GA | 593 |
| Freeborn County Adult Detention Center | MN | 74 |
| Geauga County Jail | OH | 51 |
| Golden State Annex | CA | 503 |
| Grand Forks County Correctional Facility | ND | 1 |
| Grayson County Jail | KY | 5 |
| Guaynabo Mdc (San Juan) | PR | 6 |
| Hancock County Public Safety Complex | MS | 13 |
| Henderson Detention | NV | 66 |
| Honolulu Federal Detention Center | HI | 20 |
| Houston Contract Detention Facility | TX | 833 |
| Iah Secure Adult Detention Facility (Polk) | TX | 802 |
| Imperial Regional Detention Facility | CA | 675 |
| Jackson Parish Correctional Center | LA | 971 |
| Jefferson County Jail | ID | 3 |
| Joe Corley Processing Ctr | TX | 813 |
| Jtf Camp Six | FL | 6 |
| Kandiyohi County Jail | MN | 140 |
| Karnes County Correctional Center | TX | 1 |
| Karnes County Immigration Processing Center | TX | 1081 |
| Kay Co Justice Facility | OK | 87 |
| Knox County Detention Facility | TN | 9 |
| Krome North Service Processing Center | FL | 551 |
| Laredo Processing Center | TX | 346 |
| Leavenworth Us Penitentiary | KS | 2 |
| Lexington County Jail | SC | 3 |
| Limestone County Detention Center | TX | 20 |
| Lubbock County Detention Center | TX | 1 |
| Madison County Jail | MS | 2 |
| Marion County Jail | IN | 2 |
| Mesa Verde Ice Processing Center | CA | 51 |
| Miami Federal Detention | FL | 15 |
| Migrant Ops Center Main A | FL | 3 |
| Monroe County Detention-Dorm | MI | 71 |
| Montgomery Ice Processing Center | TX | 1228 |
| Moshannon Valley Processing Center | PA | 1208 |
| Nevada Southern Detention Center | NV | 253 |
| New Hanover County Jail | NC | 1 |
| Northwest Ice Processsing Center | WA | 787 |
| Oldham County Jail | KY | 2 |
| Orange County Jail (Fl) | FL | 7 |
| Orange County Jail (Ny) | NY | 81 |
| Otay Mesa Detention Center | CA | 1391 |
| Otero County Processing Center | NM | 819 |
| Phelps County Jail | NE | 27 |
| Pickens County Det Ctr | AL | 34 |
| Pike County Jail | PA | 182 |
| Pine Prairie Ice Processing Center | LA | 627 |
| Pinellas County Jail | FL | 6 |
| Plymouth County Correctional Facility | MA | 390 |
| Polk County Jail | IA | 32 |
| Port Isabel Spc | TX | 986 |
| Pottawattamie County Jail | IA | 33 |
| Prairieland Detention Center | TX | 606 |
| Prince Edward County (Farmville) | VA | 462 |
| Richwood Correctional Center | LA | 788 |
| Rio Grande Detention Center | TX | 623 |
| River Correctional Center | LA | 553 |
| Robert A Deyton Detention Facility | GA | 3 |
| Saipan Department Of Corrections (Susupe) | MP | 4 |
| Salt Lake County Metro Jail | UT | 6 |
| San Juan Staging | PR | 3 |
| San Luis Regional Detention Center | AZ | 44 |
| Seneca County Jail | OH | 62 |
| Sherburne County Jail | MN | 12 |
| South Central Regional Jail | WV | 5 |
| South Louisiana Ice Processing Center | LA | 820 |
| South Texas Ice Processing Center | TX | 1666 |
| St. Clair County Jail | MI | 74 |
| Stewart Detention Center | GA | 1559 |
| Strafford County Corrections | NH | 86 |
| Sweetwater County Jail | WY | 1 |
| T Don Hutto Detention Center | TX | 423 |
| Torrance/Estancia, Nm | NM | 380 |
| Tulsa County Jail (David L. Moss Justice Ctr) | OK | 6 |
| Washington County Detention Center | AR | 3 |
| Washoe County Jail | NV | 9 |
| Webb County Detention Center (Cca) | TX | 298 |
| Winn Correctional Center | LA | 1491 |
| Wyatt Detention Center | RI | 111 |
ICE Detentions in Recent Years
Between October 2014 and November 2024, ICE detentions totaled 3.62 million, which involved physically transferring people to detention facilities.
Book-ins were highest in 2019, at 510,850. But, they were at a 10-year low in 2020—the first year of the pandemic—at 182,870. Mexican citizens comprised the largest share of people booked (31.1%), followed by Guatemalans (17.1%) and Hondurans (12.8%).
Between October 2018 and November 2024, about 29.0% of detainees had a criminal record in the United States. In the previous year, among those detainees with criminal records, 43.8% were convicted of misdemeanors, 35.2% of felonies, and 17.0% of aggravated felonies.
A National Conversation
ICE aims to enforce the U.S. federal border control laws regarding customs, trade, and immigration. However, the agency has been at the center of a national conversation over the aggressive deportations of many foreign nationals.
Learn More on the Voronoi App ![]()
How much fentanyl has the U.S. seized along its borders? See this graphic on Voronoi to find out.
The post Mapped: How Many People Are ICE Detaining? appeared first on Visual Capitalist.