![]()
See this visualization first on the Voronoi app.
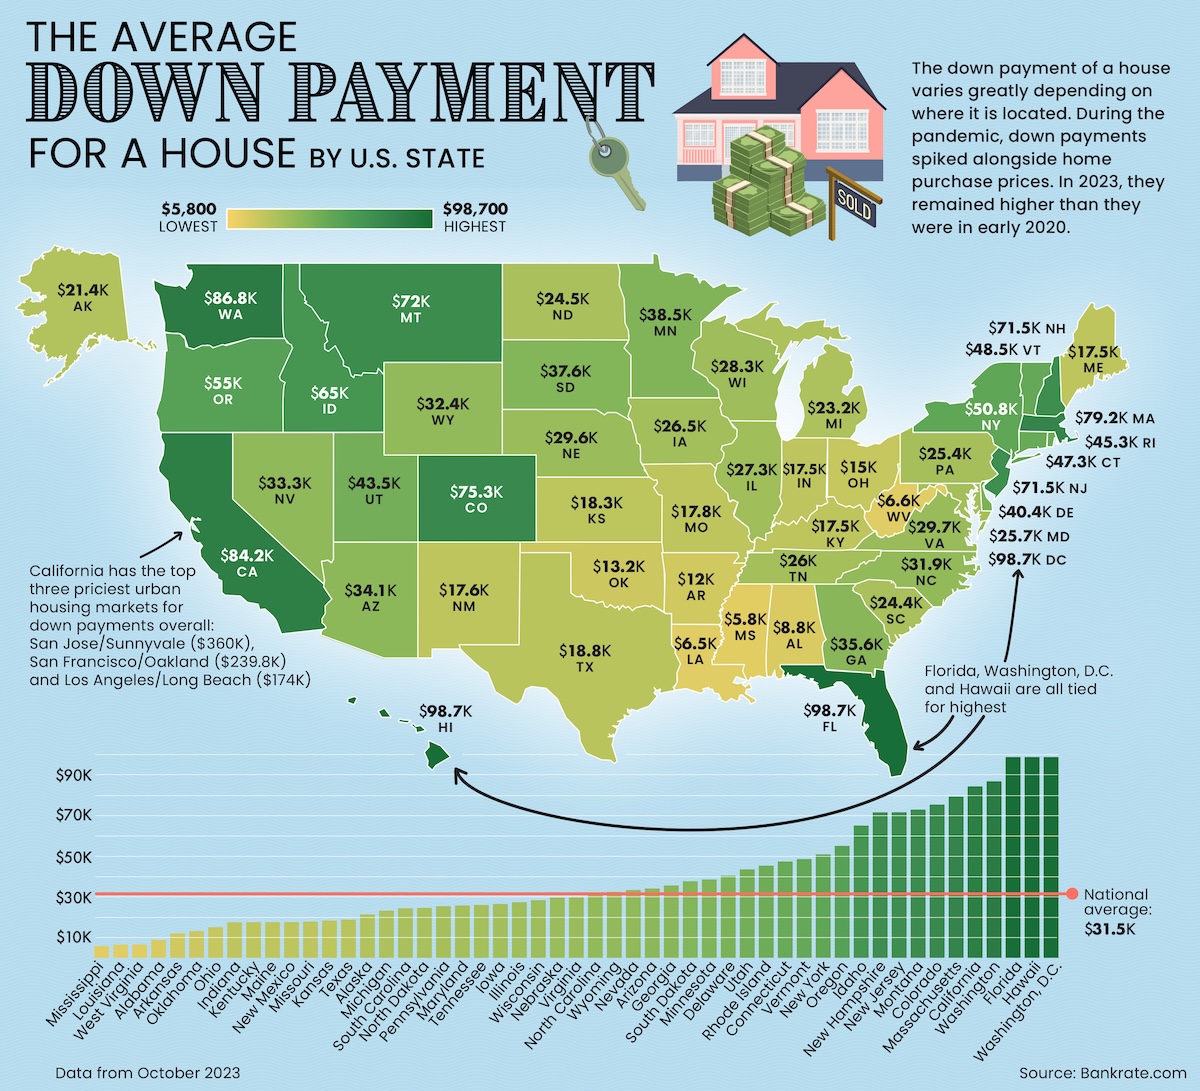
The Median Down Payment for a House, by U.S. State
This was originally posted on our Voronoi app. Download the app for free on iOS or Android and discover incredible data-driven charts from a variety of trusted sources.
Since housing costs vary across U.S. states, so too does the income required to buy a house, and the down payment associated with the purchase.
But how much does the median value change per state?
Creator Julie Peasley maps the median down payment on a single-family home by U.S. state, using data from Realtor.com, accessed through Bankrate, a publisher and rate comparison service focused on the banking industry.
Importantly, a “single-family home” is legally defined as a “structure used as a single-dwelling unit,” which includes:
- No common walls
- Built on its own parcel of land
- Private entrance/exit
- One set of utilities
- Single kitchen
This means actual house square footage will vary within and across the states, affecting the median prices and down payments in this data.
The Data: Median Down Payments by State
The top three priciest places for down payments are tied for number one: Washington D.C., Florida, and Hawaii, at a whopping $98,670.
| Rank | U.S. State | Median Down Payment | Average Down Payment Percentage |
|---|---|---|---|
| 1 | Florida | $98,670 | 17.0% |
| 2 | Hawaii | $98,670 | 17.0% |
| 3 | Washington, D.C. | $98,670 | 20.9% |
| 4 | Washington | $86,752 | 28.6% |
| 5 | California | $84,244 | 18.4% |
| 6 | Massachusetts | $79,206 | 18.9% |
| 7 | Colorado | $75,304 | 18.5% |
| 8 | Montana | $72,833 | 21.0% |
| 9 | New Jersey | $71,547 | 18.0% |
| 10 | New Hampshire | $71,500 | 20.0% |
| 11 | Idaho | $64,985 | 20.2% |
| 12 | Oregon | $55,015 | 17.3% |
| 13 | New York | $50,843 | 17.0% |
| 14 | Vermont | $48,534 | 17.5% |
| 15 | Connecticut | $47,342 | 18.6% |
| 16 | Rhode Island | $45,285 | 16.6% |
| 17 | Utah | $43,488 | 16.4% |
| 18 | Delaware | $40,412 | 17.0% |
| 19 | Minnesota | $38,500 | 16.1% |
| 20 | South Dakota | $37,630 | 16.8% |
| 21 | Georgia | $35,572 | 15.9% |
| 22 | Arizona | $34,072 | 15.4% |
| 23 | Nevada | $33,306 | 15.0% |
| 24 | Wyoming | $32,389 | 16.0% |
| 25 | North Carolina | $31,867 | 14.5% |
| 26 | Virginia | $29,704 | 13.5% |
| 27 | Nebraska | $29,617 | 15.4% |
| 28 | Wisconsin | $28,333 | 15.0% |
| 29 | Illinois | $27,348 | 14.3% |
| 30 | Iowa | $26,461 | 15.5% |
| 31 | Tennessee | $25,969 | 14.6% |
| 32 | Maryland | $25,723 | 11.9% |
| 33 | Pennsylvania | $25,402 | 13.8% |
| 34 | North Dakota | $24,543 | 15.0% |
| 35 | South Carolina | $24,357 | 15.1% |
| 36 | Michigan | $23,153 | 14.2% |
| 37 | Alaska | $21,354 | 12.2% |
| 38 | Texas | $18,780 | 12.2% |
| 39 | Kansas | $18,325 | 13.1% |
| 40 | Missouri | $17,832 | 12.9% |
| 41 | New Mexico | $17,576 | 12.6% |
| 42 | Kentucky | $17,548 | 13.4% |
| 43 | Maine | $17,548 | 16.0% |
| 44 | Indiana | $17,477 | 12.6% |
| 45 | Ohio | $15,044 | 12.3% |
| 46 | Oklahoma | $13,177 | 12.3% |
| 47 | Arkansas | $11,996 | 11.8% |
| 48 | Alabama | $8,788 | 10.7% |
| 49 | West Virginia | $6,611 | 9.2% |
| 50 | Louisiana | $6,470 | 9.2% |
| 51 | Mississippi | $5,814 | 9.3% |
| N/A | National | $31,500 | 15.0% |
Note: Current as of Q3, 2023.
Ranked 4th and 5th are Washington State and California, requiring median down payments in the mid-$80,000s.
Unsurprisingly the median down payment patterns follow how expensive housing is in that particular state, which in itself is a reflection of jobs, income, population, amenities, and the desirability of the location. By looking at the median, it also cuts out the “high end” that would skew the average (mean) payment higher.
At the bottom of the list, Alabama, West Virginia, Louisiana, and Mississippi all average less than $10,000 in median down payments.
However looking at the percentage of the total value put down as a down payment in those states (10%) indicates homebuyers there tend to have longer repayment plans. This is in contrast to the median down payment in Washington, which is close to one-third of the total house value.
Work From Home and U.S. Real Estate
The U.S. housing market has seen quite an upheaval in the last few years. Between December 2019 and November 2021, house prices rose nearly 24%, the fastest rate on record. Research found that areas that were more exposed to remote work experienced higher price growth.
Following the trend of skyrocketing house prices, the national average for down payments has also more than doubled from $13,250 in Q1 2020 to $31,500 in Q3, 2023, per earlier linked Bankrate data.
Rents have also climbed significantly, pricing many young adults out of moving out of their parents homes, which in turn has fueled luxury spending with more disposable income.
On the other hand, the commercial real estate market has struggled with falling demand and higher interest rates, putting downward pressure on prices in the sector.
The post Mapped: The Median Down Payment for a House, by U.S. State appeared first on Visual Capitalist.