![]()
See this visualization first on the Voronoi app.
Use This Visualization
Mapped: The Most and Least Expensive U.S. States
This was originally posted on our Voronoi app. Download the app for free on iOS or Android and discover incredible data-driven charts from a variety of trusted sources.
Key Takeaways
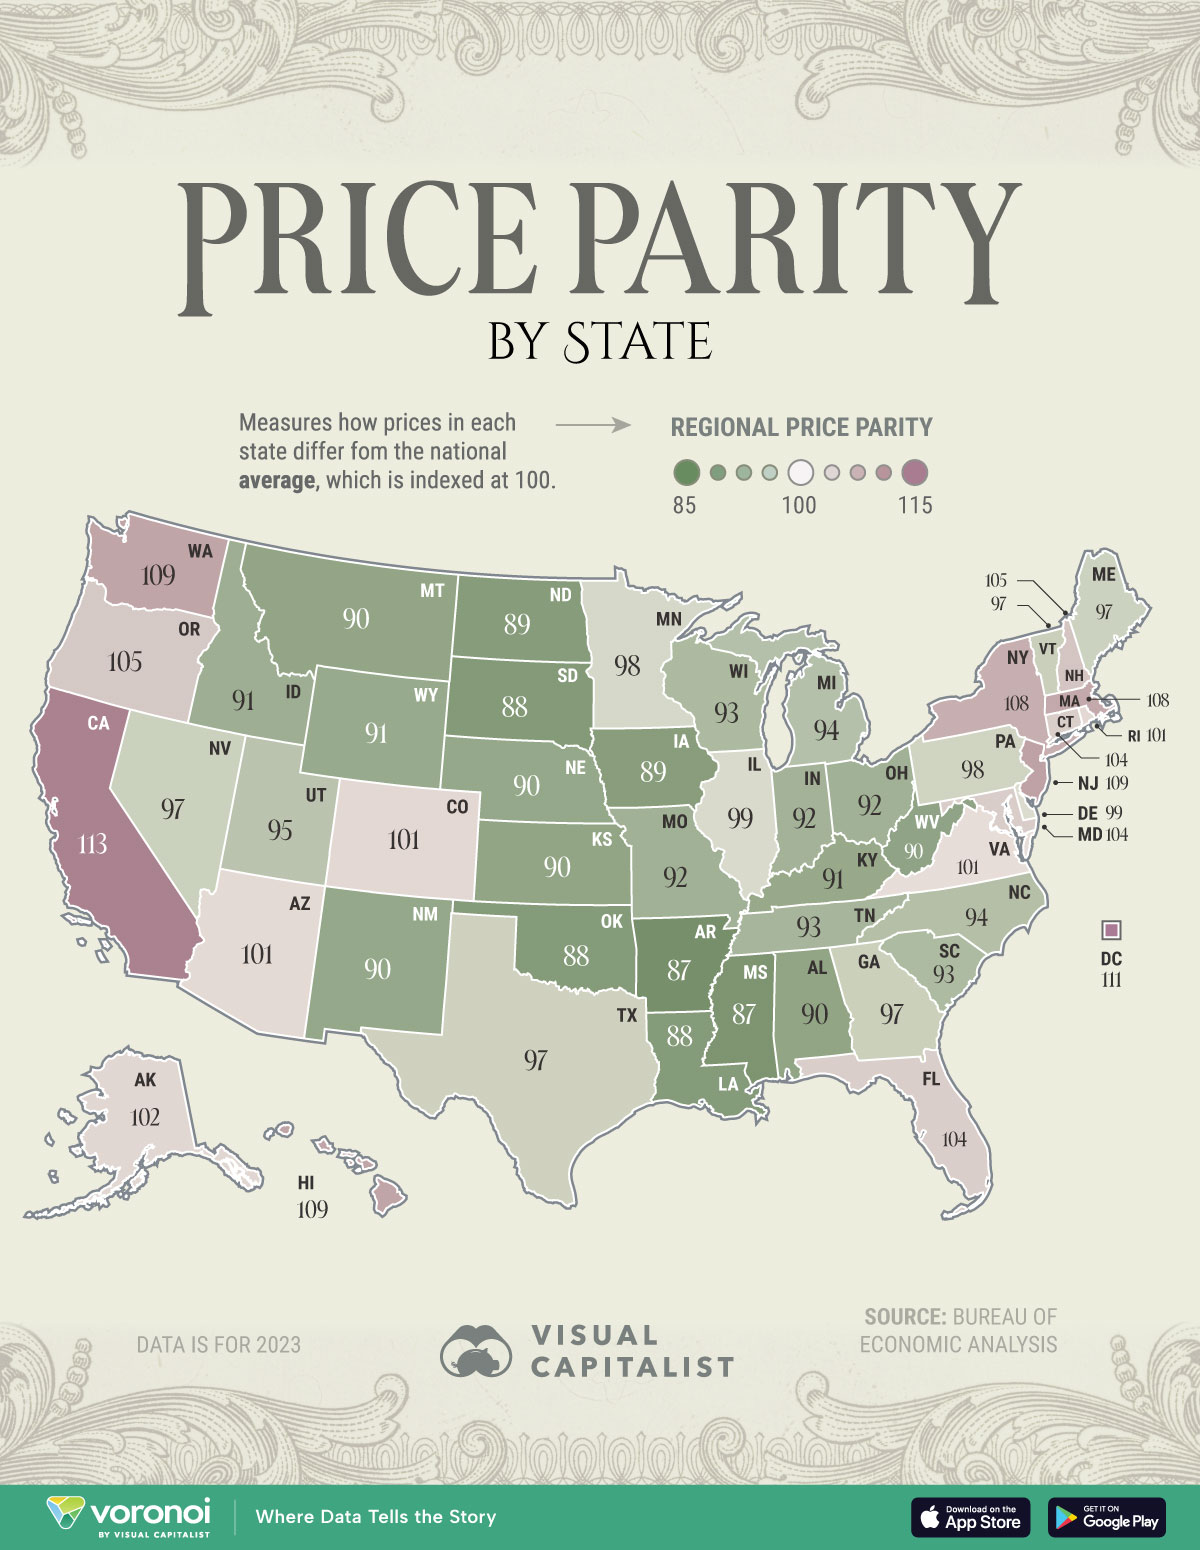
- California stands as the nation’s most expensive state, with a regional price parity (RPP) of 113 when indexed against the U.S. average of 100.
- Following in second is Washington D.C., with a RPP of 111—driven significantly by housing costs.
- Arkansas ranks as the least expensive state, with costs 13% lower than the national average.
How much do prices actually differ across America?
When factoring the price of food, bills, gas, and a host of other living costs, one clue lies in regional price parity. In short, it compiles all of these data points into one to show the real prices of goods compared to the U.S. average.
In this graphic, we show the most and least expensive states in America, based on data from the Bureau of Economic Analysis.
Southern States Have the Lowest Cost of Living
Adjusted for inflation, California is the nation’s most expensive state—with prices 13% higher than the national average in 2023.
Meanwhile, real prices in New Jersey are 9% higher overall, given the states limited housing supply, high utility bills, and rising grocery prices. Among the factors driving up food costs are real estate expenses and labor costs.
| State | Regional Price Parity (U.S. = 100) |
|---|---|
| California | 113 |
| Washington DC | 111 |
| New Jersey | 109 |
| Hawaii | 109 |
| Washington | 109 |
| Massachusetts | 108 |
| New York | 108 |
| New Hampshire | 105 |
| Oregon | 105 |
| Maryland | 104 |
| Connecticut | 104 |
| Florida | 104 |
| Alaska | 102 |
| Rhode Island | 101 |
| Colorado | 101 |
| Arizona | 101 |
| Virginia | 101 |
| Delaware | 99 |
| Illinois | 99 |
| Minnesota | 98 |
| Pennsylvania | 98 |
| Texas | 97 |
| Maine | 97 |
| Nevada | 97 |
| Georgia | 97 |
| Vermont | 97 |
| Utah | 95 |
| Michigan | 94 |
| North Carolina | 94 |
| South Carolina | 93 |
| Wisconsin | 93 |
| Tennessee | 93 |
| Indiana | 92 |
| Ohio | 92 |
| Missouri | 92 |
| Idaho | 91 |
| Wyoming | 91 |
| Kentucky | 91 |
| New Mexico | 90 |
| Nebraska | 90 |
| Montana | 90 |
| Alabama | 90 |
| Kansas | 90 |
| West Virginia | 90 |
| Iowa | 89 |
| North Dakota | 89 |
| Louisiana | 88 |
| Oklahoma | 88 |
| South Dakota | 88 |
| Mississippi | 87 |
| Arkansas | 87 |
By contrast, the least expensive states are Arkansas, Mississippi, and Oklahoma.
Owing to its affordability and job prospects, more Americans moved to Arkansas than any other state in 2024. Notably, the median listing price in Arkansas was $285,000 compared to $585,000 in Washington D.C.
Meanwhile, prices in states like Texas and Nevada fall just under the national average. For Texas in particular, its favorable tax climate and construction boom has helped mitigate cost pressures. Moreover, an influx of new residents and corporate headquarters are relocating to the state thanks to its diverse economy.
Learn More on the Voronoi App ![]()
To learn more about this topic from an affordability perspective, check out this graphic on home affordability scores by U.S. state.