![]()
See more visuals like this on the Voronoi app.
Use This Visualization
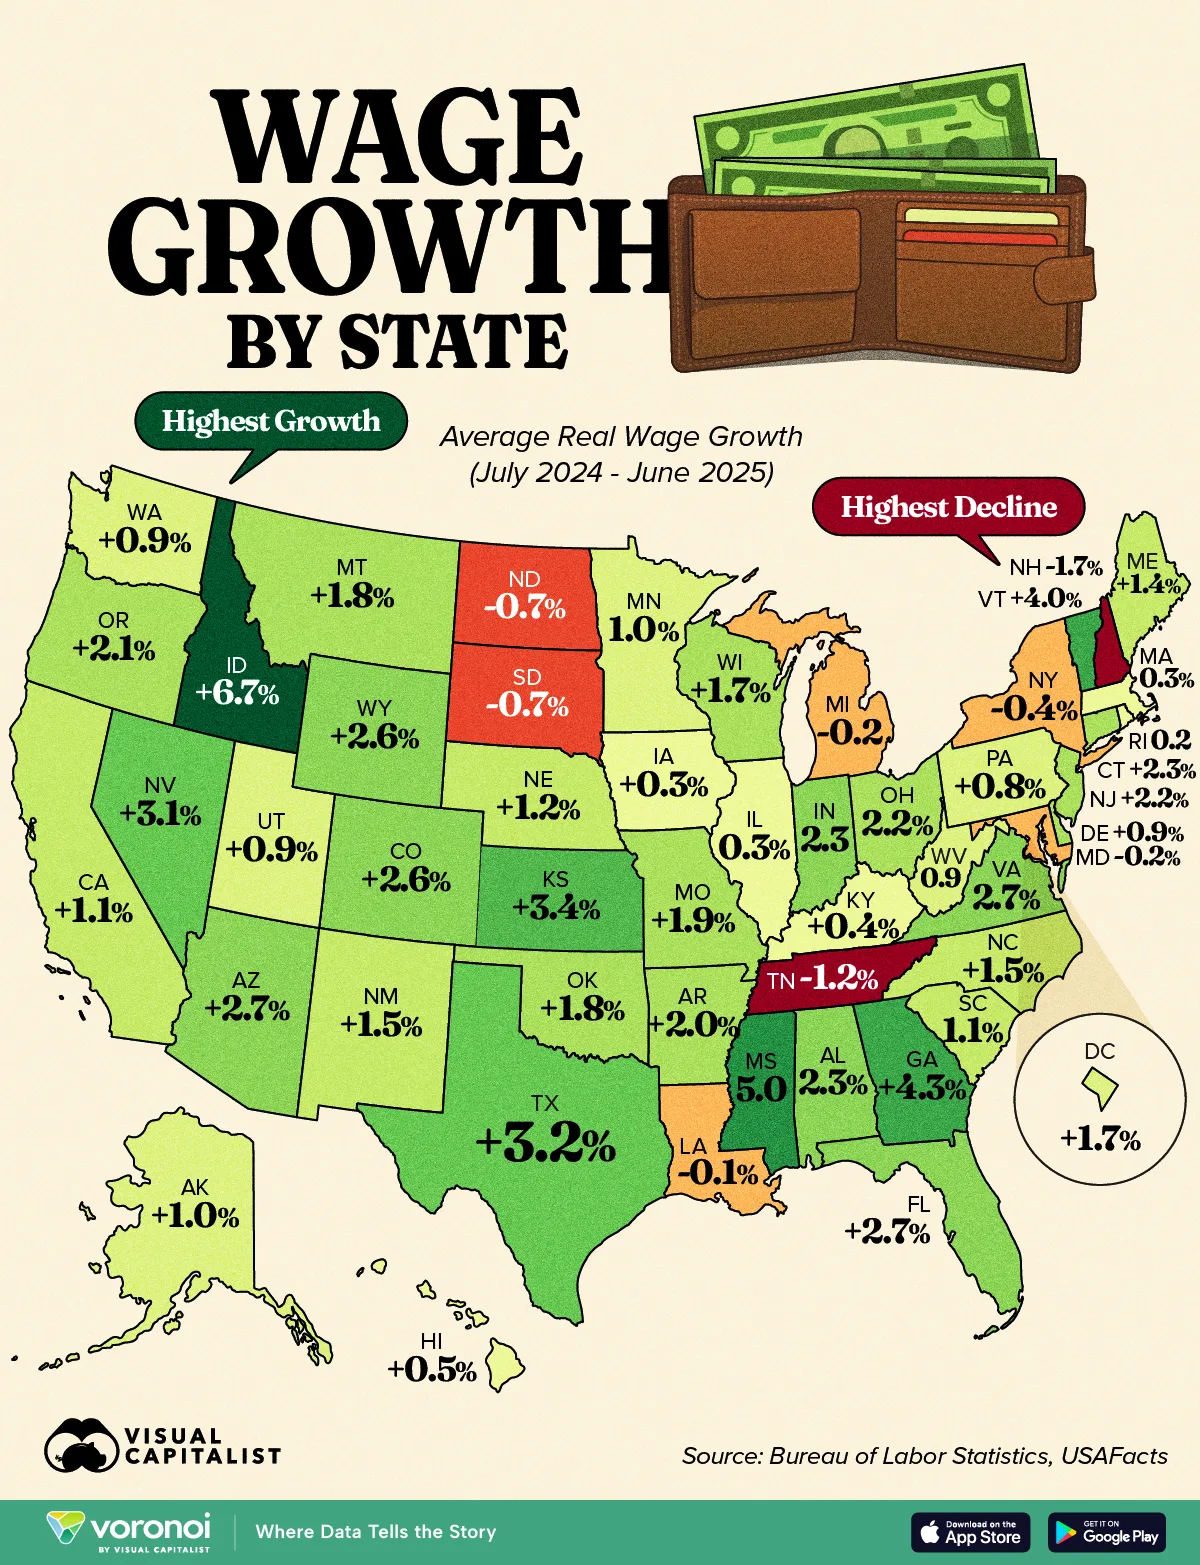
Mapped: Wage Growth by State (2024-2025)
See visuals like this from many other data creators on our Voronoi app. Download it for free on iOS or Android and discover incredible data-driven charts from a variety of trusted sources.
Key Takeaways
- Real wages (wages adjusted for inflation) increased in 42 states and D.C. over the past year ending June 2025.
- Idaho and Mississippi saw the strongest average wage gains at 6.7% and 5.0%.
Real wage growth in the U.S. has become a central focus as inflation and new tariffs continue to strain Americans’ purchasing power.
Nationally, between July 2024 and June 2025, the nominal average wage rose from $1,200 to $1,250 per week—a $50 increase, or 4.2% growth. After adjusting for inflation, real wages grew 2.5%, giving workers about $30 more in weekly purchasing power.
This map highlights how each state performed in the 12 months ending June 2025, showing where workers are gaining purchasing power, and where they are still falling behind. The data for this visualization comes from USAFacts.
States Leading Wage Growth
Idaho and Mississippi top the nation, with real wages rising 6.7% and 5.0%. Both states have seen rapid population inflows and tight labor markets, contributing to stronger wage pressures.
Other high-performing states, including Georgia, Vermont, and Kansas, also recorded gains above 3%.
| State | Real wage growth (Avg.) |
|---|---|
| Idaho | 6.7% |
| Mississippi | 5.0% |
| Georgia | 4.3% |
| Vermont | 4.0% |
| Kansas | 3.4% |
| Texas | 3.2% |
| Nevada | 3.1% |
| Arizona | 2.7% |
| Florida | 2.7% |
| Virginia | 2.7% |
| Colorado | 2.6% |
| Wyoming | 2.6% |
| Alabama | 2.3% |
| Indiana | 2.3% |
| Connecticut | 2.2% |
| New Jersey | 2.2% |
| Ohio | 2.2% |
| Oregon | 2.1% |
| Arkansas | 2.0% |
| Missouri | 1.9% |
| Montana | 1.8% |
| Oklahoma | 1.8% |
| DC | 1.7% |
| Wisconsin | 1.7% |
| New Mexico | 1.5% |
| North Carolina | 1.5% |
| Maine | 1.4% |
| Nebraska | 1.2% |
| California | 1.1% |
| South Carolina | 1.1% |
| Alaska | 1.0% |
| Minnesota | 1.0% |
| Delaware | 0.9% |
| Utah | 0.9% |
| Washington | 0.9% |
| West Virginia | 0.9% |
| Pennsylvania | 0.8% |
| Hawaii | 0.5% |
| Kentucky | 0.4% |
| Illinois | 0.3% |
| Iowa | 0.3% |
| Massachusetts | 0.3% |
| Rhode Island | 0.2% |
| Louisiana | -0.1% |
| Maryland | -0.2% |
| Michigan | -0.2% |
| New York | -0.4% |
| North Dakota | -0.7% |
| South Dakota | -0.7% |
| Tennessee | -1.2% |
| New Hampshire | -1.7% |
| U.S. National Average | 2.5% |
Moderate but Positive Growth Across Much of the Country
A large portion of states saw real wage gains between 1% and 3%. This group includes major population centers like Texas, Florida, Virginia, and Colorado.
Steady job creation and cooling inflation have helped wages outpace consumer prices in these areas.
Where Wage Growth Is Falling Behind
Eight states recorded negative real wage growth, meaning inflation outpaced pay increases. New Hampshire, Tennessee, and the Dakotas saw some of the largest declines, reflecting weaker labor market conditions.
New York and Michigan also posted modest decreases, suggesting ongoing economic transitions are weighing on earnings. These pockets of decline stand out against the broader national trend of improvement.
Learn More on the Voronoi App ![]()
If you enjoyed today’s post, check out Ranked: The Cities Americans Are Moving To on Voronoi, the new app from Visual Capitalist.