![]()
See this visualization first on the Voronoi app.
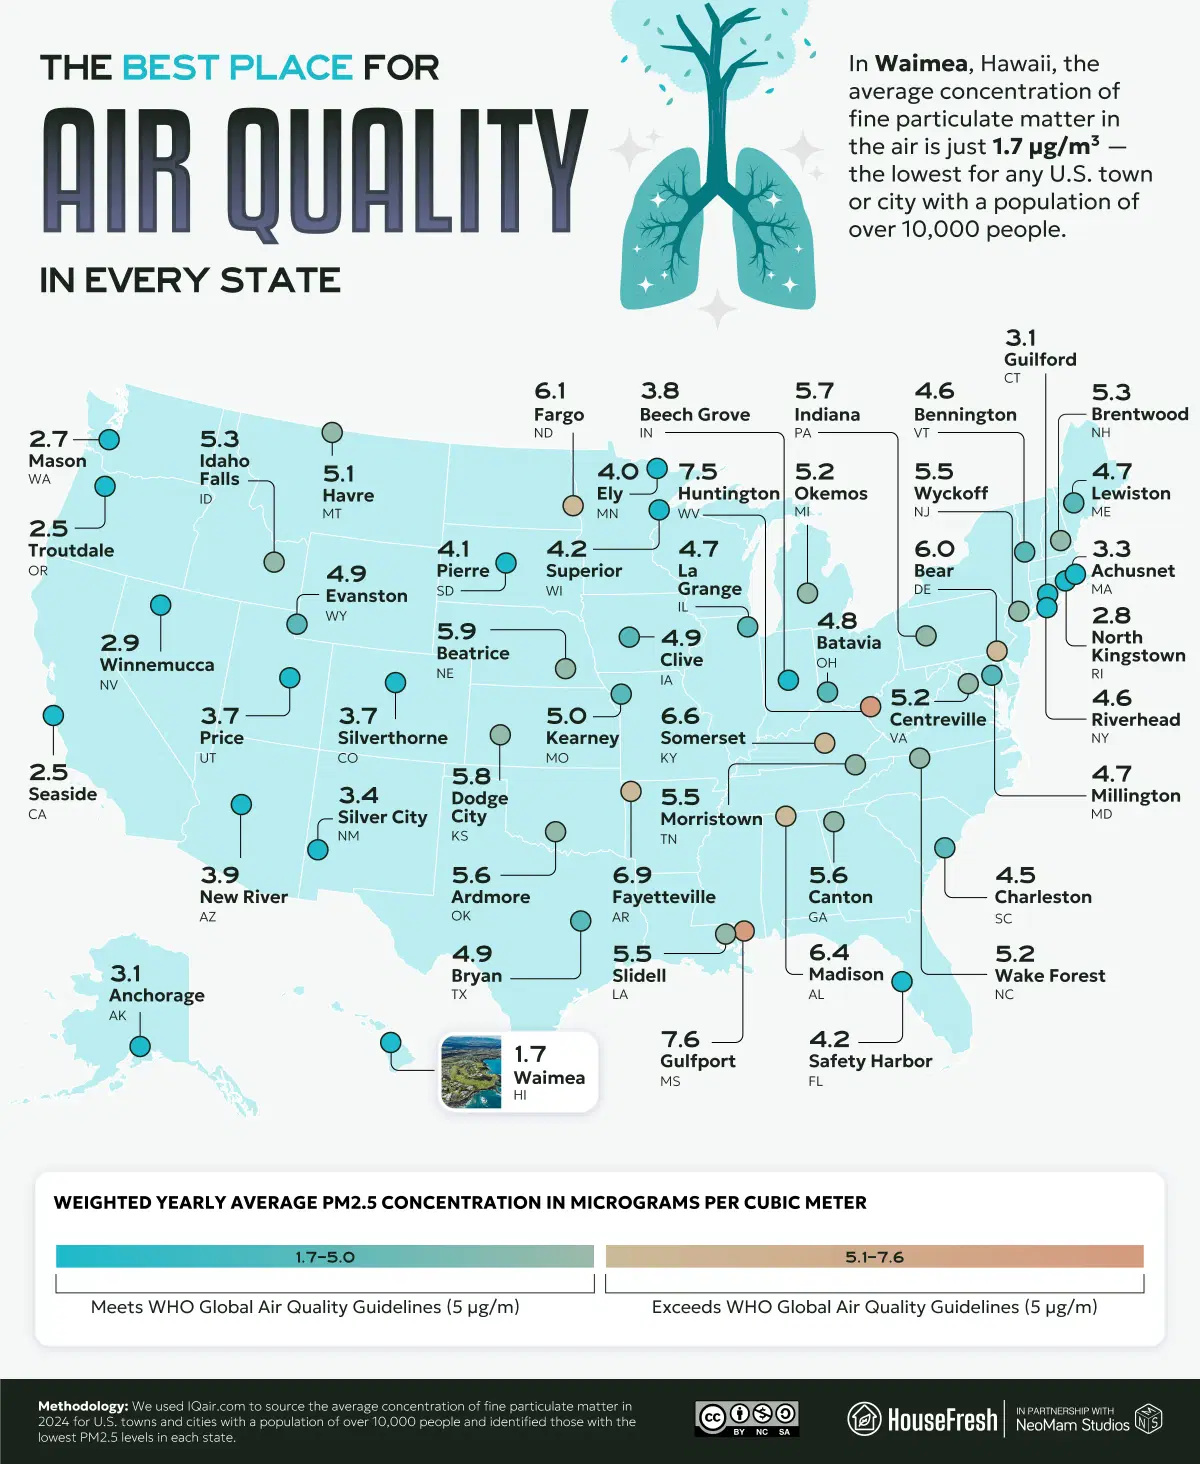
Mapped: Where the Air Quality is Best in Each U.S. State
This was originally posted on our Voronoi app. Download the app for free on iOS or Android and discover incredible data-driven charts from a variety of trusted sources.
- Waimea, Hawaii has the cleanest air in the U.S., with PM2.5 levels of just 1.7 µg/m³.
- California’s Seaside and Oregon’s Troutdale both report just 2.5 µg/m³, well below WHO guidelines.
- Gulfport, Mississippi is the “best” city in its state but still exceeds WHO safety levels at 7.6 µg/m³.
Air quality varies dramatically across the U.S., and one way scientists measure this is through PM2.5, or fine particulate matter. Defined as particles less than 2.5 micrometers wide—smaller than 1/30th the width of a human hair—PM2.5 can penetrate deep into lungs and enter the bloodstream. High concentrations have been linked to asthma, heart disease, and reduced life expectancy.
HouseFresh, using data from IQAir, identified the cleanest-air cities in each state in 2024, based on yearly averages for cities with populations above 10,000.
Here are the U.S. cities with the best air quality in each state:
| City | State | Yearly Average PM2.5 Concentration (2024) | Equivalent Cigarettes Smoked in 2024 |
|---|---|---|---|
| Waimea | Hawaii | 1.7 | 28 |
| Seaside | California | 2.5 | 41 |
| Troutdale | Oregon | 2.5 | 41 |
| Mason | Washington | 2.7 | 45 |
| North Kingstown | Rhode Island | 2.8 | 46 |
| Winnemucca | Nevada | 2.9 | 48 |
| Anchorage | Alaska | 3.1 | 51 |
| Guilford | Connecticut | 3.1 | 51 |
| Acushnet | Massachusetts | 3.3 | 55 |
| Silver City | New Mexico | 3.4 | 56 |
| Silverthorne | Colorado | 3.7 | 61 |
| Price | Utah | 3.7 | 61 |
| Beech Grove | Indiana | 3.8 | 63 |
| New River | Arizona | 3.9 | 65 |
| Ely | Minnesota | 4.0 | 66 |
| Pierre | South Dakota | 4.1 | 68 |
| Safety Harbor | Florida | 4.2 | 70 |
| Superior | Wisconsin | 4.2 | 70 |
| Charleston | South Carolina | 4.5 | 75 |
| Riverhead | New York | 4.6 | 76 |
| Bennington | Vermont | 4.6 | 76 |
| La Grange | Illinois | 4.7 | 78 |
| Lewiston | Maine | 4.7 | 78 |
| Millington | Maryland | 4.7 | 78 |
| Batavia | Ohio | 4.8 | 80 |
| Clive | Iowa | 4.9 | 81 |
| Bryan | Texas | 4.9 | 81 |
| Evanston | Wyoming | 4.9 | 81 |
| Kearney | Missouri | 5.0 | 83 |
| Havre | Montana | 5.1 | 85 |
| Okemos | Michigan | 5.2 | 86 |
| Wake Forest | North Carolina | 5.2 | 86 |
| Centreville | Virginia | 5.2 | 86 |
| Idaho Falls | Idaho | 5.3 | 88 |
| Brentwood | New Hampshire | 5.3 | 88 |
| Slidell | Louisiana | 5.5 | 91 |
| Wyckoff | New Jersey | 5.5 | 91 |
| Morristown | Tennessee | 5.5 | 91 |
| Canton | Georgia | 5.6 | 93 |
| Ardmore | Oklahoma | 5.6 | 93 |
| Indiana | Pennsylvania | 5.7 | 95 |
| Dodge City | Kansas | 5.8 | 96 |
| Beatrice | Nebraska | 5.9 | 98 |
| Bear | Delaware | 6.0 | 100 |
| Fargo | North Dakota | 6.1 | 101 |
| Madison | Alabama | 6.4 | 106 |
| Somerset | Kentucky | 6.6 | 110 |
| Fayetteville | Arkansas | 6.9 | 114 |
| Huntington | West Virginia | 7.5 | 124 |
| Gulfport | Mississippi | 7.6 | 126 |
At a glance, Waimea, Hawaii stands out at just 1.7 µg/m³—equivalent to inhaling only 28 cigarettes in a year—making it the cleanest air in America.
Hawaii, Oregon, and California Lead the Pack
Waimea’s clean air benefits from trade winds that disperse pollution, despite occasional volcanic smog, or “vog.” Meanwhile, Oregon’s Troutdale and California’s Seaside also post ultra-low PM2.5 averages of 2.5 µg/m³, underscoring the relative strength of West Coast air quality compared to other parts of the country.
In contrast, states like Mississippi and West Virginia see their cleanest cities—Gulfport (7.6 µg/m³) and Huntington (7.5 µg/m³)—still fall above the World Health Organization’s recommended safe threshold of 5 µg/m³.
A Mixed Map of Clean Air
While many Northeastern states such as Maine (Lewiston, 4.7 µg/m³) and Vermont (Bennington, 4.6 µg/m³) report relatively clean air, industrial and agricultural regions in the Midwest often post higher averages. Fargo, North Dakota (6.1 µg/m³) and Dodge City, Kansas (5.8 µg/m³) illustrate this trend.
Still, the fact that more than half of the listed cities come in under WHO guidelines is encouraging, highlighting regional success in curbing emissions and maintaining cleaner skies.
The Other Side of the Story
The cleanest and dirtiest U.S. cities also illustrate the huge gap in air quality nationwide. Waimea, Hawaii records just 1.7 µg/m³ of PM2.5, while Shafter, California reaches 16.1 µg/m³—almost 10 times higher. This contrast shows how local industries, environmental policies, and geography can dramatically shape the air people breathe.
Learn More on the Voronoi App
See the flip side in this map of the worst place for air quality in each U.S. state.