![]()
See more visualizations like this on the Voronoi app.
Use This Visualization
Where Americans Need Housing Assistance, Ranked by State
See visuals like this from many other data creators on our Voronoi app. Download it for free on iOS or Android and discover incredible data-driven charts from a variety of trusted sources.
Key Takeaways
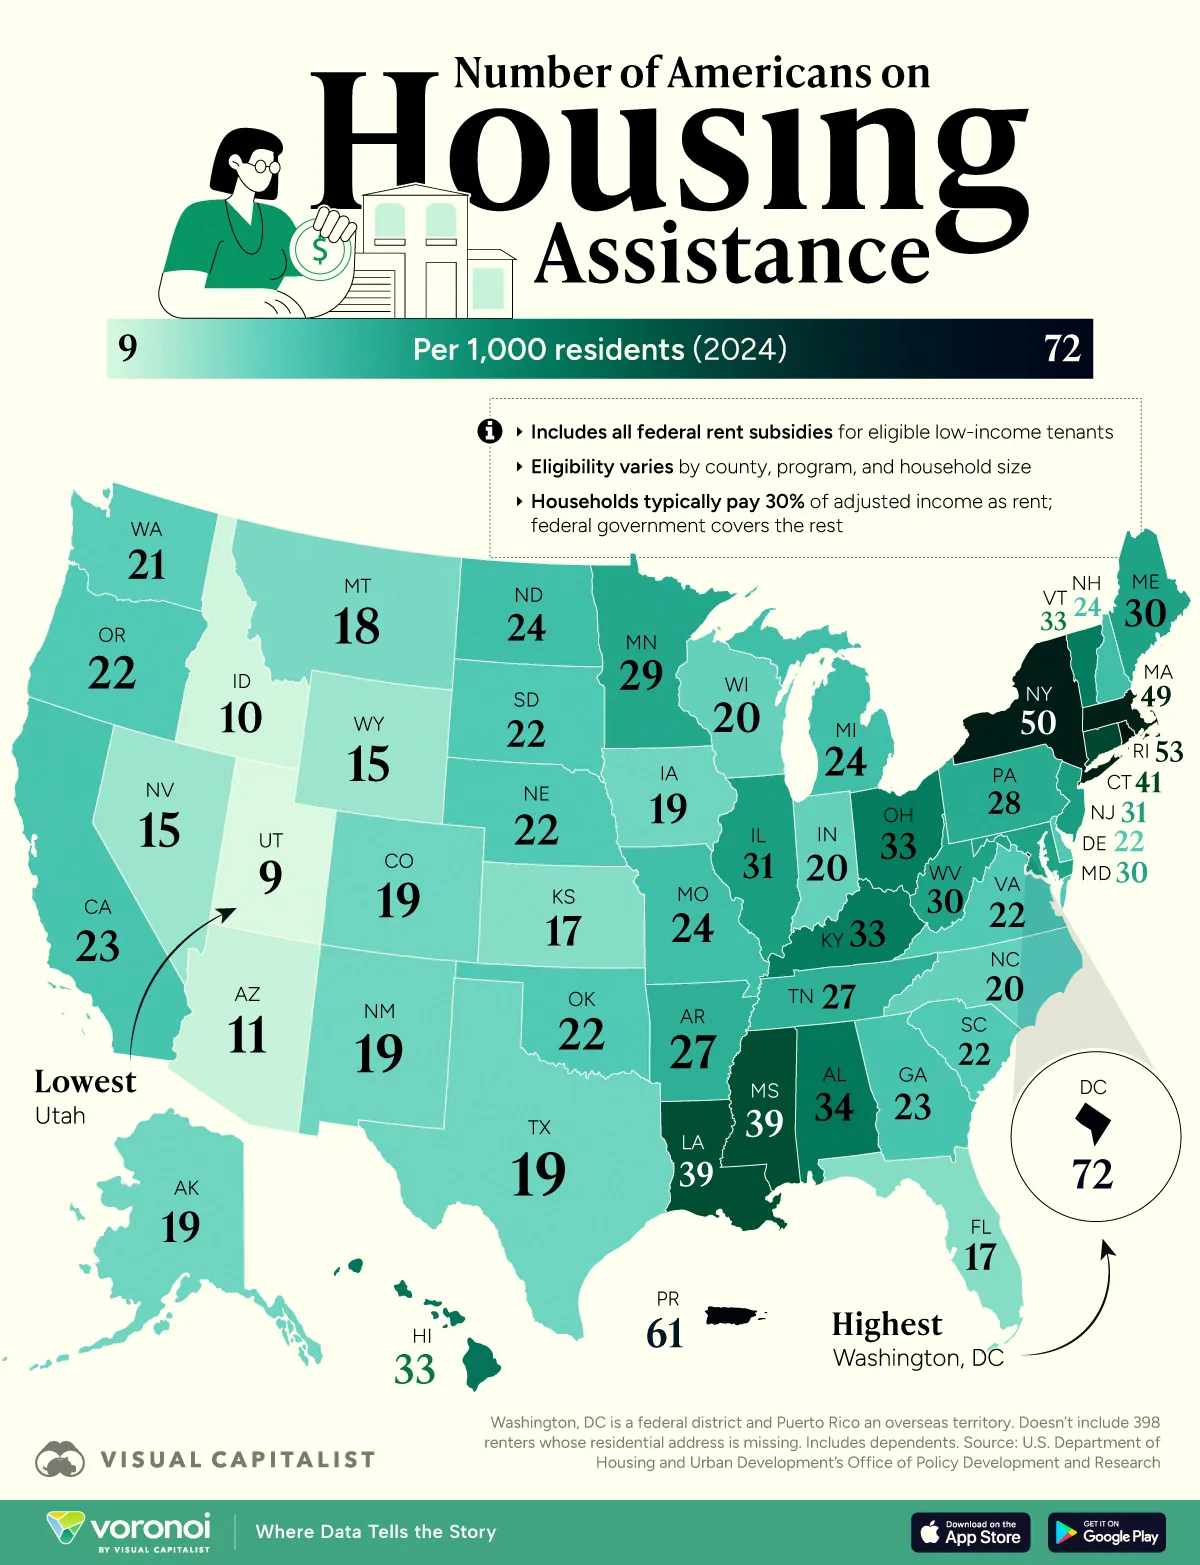
- D.C. has the highest share of low-income renters on housing assistance: 72 per 1,000 residents. It’s followed by Puerto Rico (61) and Rhode Island (53).
- In absolute numbers, the country’s four largest states—New York (1 million), California (919K), Texas (595K), and Florida (405K)—support the most renters.
- All data as of 2024.
Housing costs keep climbing faster than wages in many parts of the U.S., putting extra pressure on low-income renters.
The visualization maps all 50 states, the District of Columbia, and Puerto Rico by how many low-income renters receive federal housing assistance relative to their population.
Data is sourced from the U.S. Department of Housing and Urban Development’s Office of Policy Development and Research (HUD).
HUD’s 2024 estimates count more than 9 million Americans (27 per 1,000) currently receiving vouchers, public-housing units, or other subsidies.
Households typically pay 30% of their adjusted income (i.e. after taxes) as rent, and the government covers the rest.
Ranked: Americans Needing Rental Assistance, by State
D.C. stands out with 72 assisted renters per 1,000 residents.
That’s more than double the U.S. average of 27 and reflects both DC’s high housing costs, its population growth since 2000, and the limited growth in housing in the same time period.
| Rank | State | Code | # of People on Housing Assistance (2024) |
State Population | # of People on Housing Assistance per 1,000 Residents |
|---|---|---|---|---|---|
| 1 | District of Columbia | DC | 50,389 | 702,250 | 72 |
| 2 | Puerto Rico | PR | 196,165 | 3,203,295 | 61 |
| 3 | Rhode Island | RI | 58,640 | 1,112,308 | 53 |
| 4 | New York | NY | 1,000,730 | 19,867,248 | 50 |
| 5 | Massachusetts | MA | 346,968 | 7,136,171 | 49 |
| 6 | Connecticut | CT | 148,989 | 3,675,069 | 41 |
| 7 | Mississippi | MS | 115,391 | 2,943,045 | 39 |
| 8 | Louisiana | LA | 178,836 | 4,597,740 | 39 |
| 9 | Alabama | AL | 175,759 | 5,157,699 | 34 |
| 10 | Ohio | OH | 392,408 | 11,883,304 | 33 |
| 11 | Vermont | VT | 21,313 | 648,493 | 33 |
| 12 | Kentucky | KY | 150,525 | 4,588,372 | 33 |
| 13 | Hawaii | HI | 47,342 | 1,446,146 | 33 |
| 14 | Illinois | IL | 392,302 | 12,710,158 | 31 |
| 15 | New Jersey | NJ | 289,801 | 9,500,851 | 31 |
| 16 | Maryland | MD | 187,764 | 6,263,220 | 30 |
| 17 | West Virginia | WV | 52,826 | 1,769,979 | 30 |
| 18 | Maine | ME | 41,698 | 1,405,012 | 30 |
| 19 | Minnesota | MN | 165,434 | 5,793,151 | 29 |
| 20 | Pennsylvania | PA | 366,433 | 13,078,751 | 28 |
| 21 | Arkansas | AR | 82,678 | 3,088,354 | 27 |
| 22 | Tennessee | TN | 193,490 | 7,227,750 | 27 |
| 23 | North Dakota | ND | 19,271 | 796,568 | 24 |
| 24 | New Hampshire | NH | 33,811 | 1,409,032 | 24 |
| 25 | Michigan | MI | 242,304 | 10,140,459 | 24 |
| 26 | Missouri | MO | 147,635 | 6,245,466 | 24 |
| 27 | California | CA | 918,612 | 39,431,263 | 23 |
| 28 | Georgia | GA | 259,256 | 11,180,878 | 23 |
| 29 | Oklahoma | OK | 92,093 | 4,095,393 | 22 |
| 30 | South Carolina | SC | 122,225 | 5,478,831 | 22 |
| 31 | Nebraska | NE | 44,628 | 2,005,465 | 22 |
| 32 | Virginia | VA | 194,664 | 8,811,195 | 22 |
| 33 | Oregon | OR | 93,896 | 4,272,371 | 22 |
| 34 | Delaware | DE | 22,865 | 1,051,917 | 22 |
| 35 | South Dakota | SD | 19,928 | 924,669 | 22 |
| 36 | Washington | WA | 170,021 | 7,958,180 | 21 |
| 37 | North Carolina | NC | 223,353 | 11,046,024 | 20 |
| 38 | Indiana | IN | 137,552 | 6,924,275 | 20 |
| 39 | Wisconsin | WI | 118,308 | 5,960,975 | 20 |
| 40 | New Mexico | NM | 40,853 | 2,130,256 | 19 |
| 41 | Alaska | AK | 14,146 | 740,133 | 19 |
| 42 | Texas | TX | 595,361 | 31,290,831 | 19 |
| 43 | Colorado | CO | 113,116 | 5,957,493 | 19 |
| 44 | Iowa | IA | 60,330 | 3,241,488 | 19 |
| 45 | Montana | MT | 20,172 | 1,137,233 | 18 |
| 46 | Florida | FL | 405,398 | 23,372,215 | 17 |
| 47 | Kansas | KS | 49,535 | 2,970,606 | 17 |
| 48 | Nevada | NV | 50,441 | 3,267,467 | 15 |
| 49 | Wyoming | WY | 8,663 | 587,618 | 15 |
| 50 | Arizona | AZ | 85,458 | 7,582,384 | 11 |
| 51 | Idaho | ID | 20,902 | 2,001,619 | 10 |
| 52 | Utah | UT | 32,862 | 3,503,613 | 9 |
| N/A | U.S. | USA | 9,039,779 | 340,110,988 | 27 |
Puerto Rico places second at 61 per 1,000—a legacy of limited job opportunities and post-hurricane rebuilding needs—while Rhode Island rounds out the top three at 53.
One study found that a minimum wage worker in Rhode Island must work an 85-hour workweek to afford a standard two-bedroom apartment.
Related: Puerto Rico also has the highest share of residents on welfare. Rhode Island is 10th and DC is 12th.
States With the Fewest Americans on Housing Assistance
Roughly half of U.S. states cluster between 20 and 30 assisted renters per 1,000 residents.
This middle group includes Midwestern states like Minnesota (29) and Michigan (24) as well as fast-growing Sun Belt hubs such as Georgia (23).
At the lower end, Western states Idaho (10) and Utah (9) report the fewest recipients per 1,000 residents. Part of that gap reflects younger demographics and higher home-ownership rates.
Related: Idaho ranks 16th and Utah 18th by home ownership rates, both higher than 70%.
But the eligibility to qualify for federal rental assistance varies by county and household size. Low numbers can also signal unmet needs or where waitlists run long.
Americans On Housing Assistance by Pure Numbers
When we shift from per-capita rates to raw counts, America’s largest states unsurprisingly dominate.
New York alone supports one million low-income renters, roughly equal to the combined totals of the bottom 10 states.
California follows closely with 919,000 recipients, reflecting the state’s chronic affordability crunch. Texas (595,000) and Florida (405,000) also rank high—even though their per-capita rates sit near the national average.
Learn More on the Voronoi App ![]()
Wondering how much money the HUD is paying out on average per renter? Check out Where Rent Subsidies Are Highest, by U.S. State on Voronoi, the new app from Visual Capitalist.