![]()
See this visualization first on the Voronoi app.
Use This Visualization
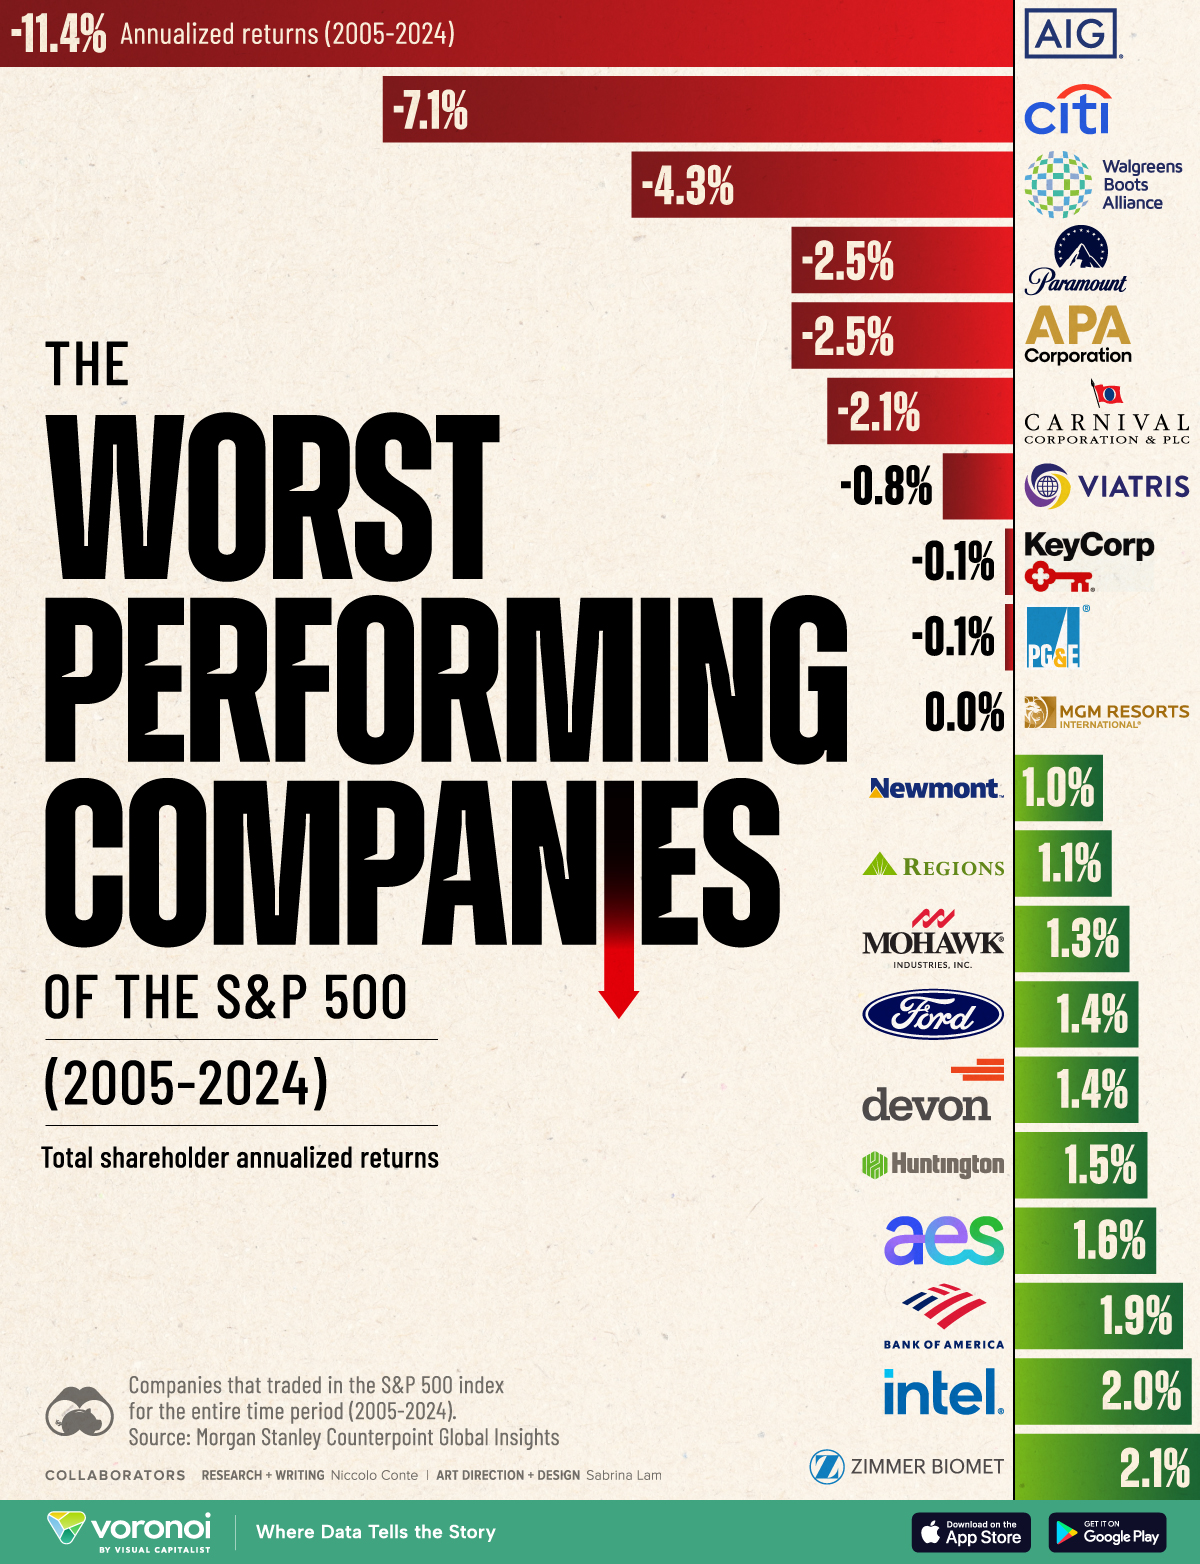
The Worst Performing Stocks in the S&P 500 (2005-2024)
This was originally posted on our Voronoi app. Download the app for free on iOS or Android and discover incredible data-driven charts from a variety of trusted sources.
Key Takeaways
- The 20 worst performing stocks in the S&P 500 have seen -0.8% annualized returns on average between 2005 and 2024.
- Insurance firm AIG is the worst performer in the index, with its share price falling from about $1,100 to $73 over the period.
- Ford also ranks among the bottom 20 given tepid growth, high warranty costs, and margin pressure.
.key-takeaways {
background: #F8F9FA;
border-left: 4px solid #2A6338;
padding: 15px;
margin: 20px 0;
border-radius: 5px;
}
.key-takeaways h3 {
margin-top: 0;
color: #2A6338;
font-weight: bold;
}
.key-takeaways ul {
padding-left: 20px;
}
.key-takeaways li {
margin-bottom: 5px;
}
Over the past 20 years, the S&P 500 has averaged 10.4% in annualized returns, navigating two major market crashes with double-digit declines.
For some stocks, these crises have had enduring impacts. In fact, some of the companies most exposed to the subprime mortgage meltdown have yet to see their share price fully recover from pre-2008 levels.
This graphic shows the worst performing stocks in the S&P 500 over the past two decades, based on data from Morgan Stanley Counterpoint Global Insights.
Financial Giants Have Seen the Weakest Returns
AIG, once the world’s largest insurance company, has seen -11.4% in annualized returns from 2005 to 2024, making it the worst performing company in the S&P 500.
The insurance juggernaut had significant exposure to the subprime mortgage market as the company increasingly focused away from its core business of underwriting insurance policies leading up to the crash. Between 2005 and 2024, its share price fell from over $1,100 to $73.
| Company | Annualized Returns 2005-2024 |
|---|---|
| American International Group | -11.4% |
| Citigroup | -7.1% |
| Walgreens Boots Alliance | -4.3% |
| Paramount Global Class B | -2.5% |
| APA Corporation | -2.5% |
| Carnival Corporation | -2.1% |
| Viatris, Inc. | -0.8% |
| KeyCorp | -0.1% |
| PG&E Corporation | -0.1% |
| MGM Resorts International | 0.0% |
| Newmont Corporation | 1.0% |
| Regions Financial Corporation | 1.1% |
| Mohawk Industries | 1.3% |
| Ford Motor Company | 1.4% |
| Devon Energy Corporation | 1.4% |
| Hungington Bancshares | 1.5% |
| AES Corporation | 1.6% |
| Bank of America Corp | 1.9% |
| Intel Corporation | 2.0% |
| Zimmer Bioment Holdings | 2.1% |
Like AIG, Citigroup was highly exposed to the credit squeeze in 2008-2009, and has seen its share price fall from around $490 in January 2005 to $70 at the end of 2024.
Despite severe losses for Citigroup, it ranks among the top banks in America by total assets. However, when it comes to share price performance, it has significantly underperformed rivals, including JPMorgan Chase & Co, which navigated the crisis successfully thanks to its diversified business model.
Also ranking on this list is legacy automaker, Ford Motor Company, with 1.4% average annualized returns over the period. While the stock has a healthy dividend, its share price appreciation has been minimal due to sluggish growth and high warranty costs. While Ford shares sank 19% in 2024, its main competitor, GM, saw its stock rise 48%.
Overall, six of the worst performing stocks are in the financial sector, including Bank of America and Huntington Bancshares. Meanwhile, three are in health care, and just one, Intel, is in the tech sector.
Learn More on the Voronoi App ![]()
To learn more about this topic from a performance perspective, check out this graphic on the best performing stocks in the S&P 500 over the last two decades.
The post Ranked: The Worst Performing Stocks in the S&P 500 (2005-2024) appeared first on Visual Capitalist.