Published
20 mins ago
on
August 4, 2025
| 14 views
-->
By
Jenna Ross
Graphics & Design
- Zack Aboulazm
The following content is sponsored by Terzo
Unpacking Real Estate Ownership by Generation (1991 vs. 2025)
Key Takeaways
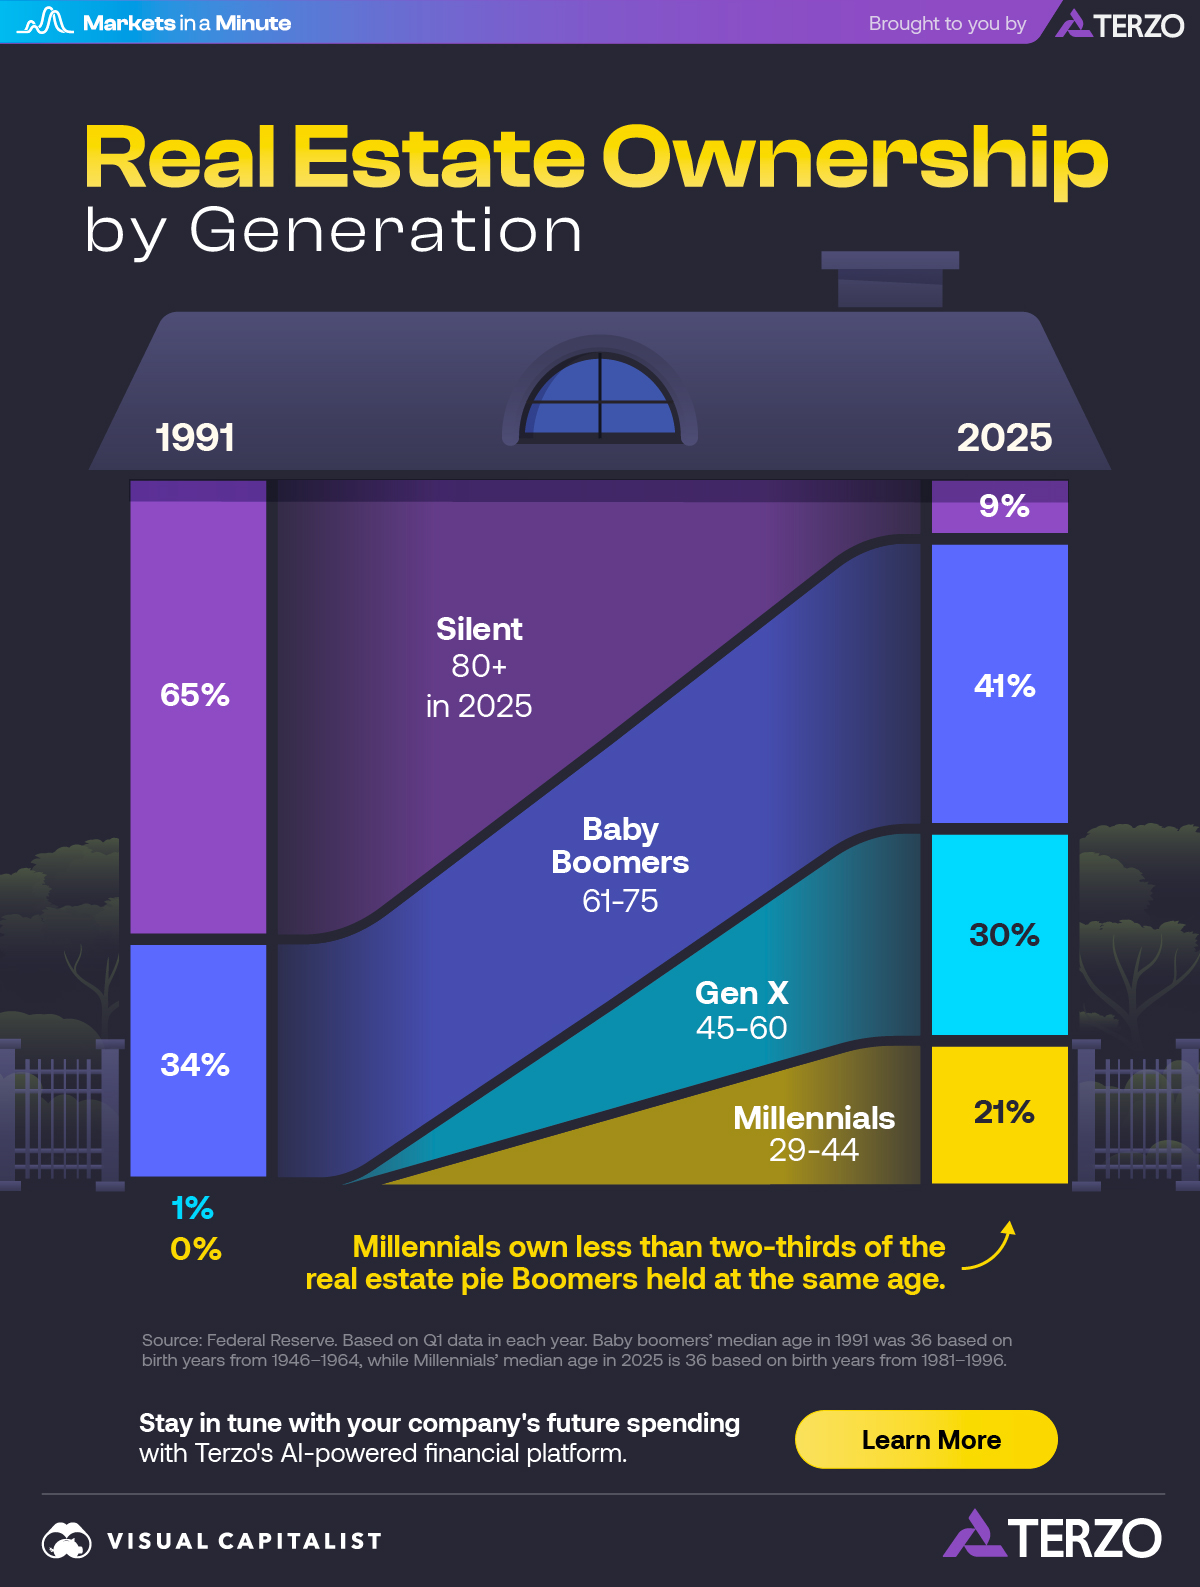
- In 1991, the Silent Generation held 65% of real estate; by 2025, that has dropped to just 9%.
- Baby Boomers own 41% of property in 2025.
- Millennials own less than two-thirds of the real estate Baby Boomers did at the same age.
Over the past three decades, America’s real estate ownership landscape has shifted dramatically. The distribution of property reflects not just wealth, but also demographic momentum—who’s aging, who’s buying, and who’s being left behind.
This Markets in a Minute graphic, created in partnership with Terzo, shows the generational breakdown of U.S. real estate ownership in 1991 and 2025.
Property Power Shifts
Using data from the Federal Reserve, we can see how the breakdown of property ownership has changed over time.
| Generation | 1991 | 2025 |
|---|---|---|
| Silent | 65% | 9% |
| Baby Boomers | 34% | 41% |
| Gen X | 1% | 30% |
| Millennials | 0% | 21% |
Back in 1991, the Silent Generation owned the lion’s share of real estate. Baby Boomers owned nearly all the rest.
By 2025, this distribution has shifted significantly. The Silent Generation’s share has dropped and Baby Boomers now own the largest percentage. Gen X, now in their peak earning years, has seen their share jump to 30%.
The Factors Driving Real Estate Ownership
The dramatic decline in Silent Generation ownership reflects aging and mortality, and can be one gauge of the wealth transfer.
But the rise of younger generations in real estate has been uneven. Millennials own less than two-thirds of what Baby Boomers did at the same age, highlighting affordability pressures, student debt, and delayed entry into homeownership.
In fact, Millennials’ share of ownership falls far behind their share of the population that is of home-owning age.
| Generation | Share of Real Estate Ownership in 2025 | Share of the Home-Owning Aged Population (29+) |
|---|---|---|
| Silent | 9% | 6% |
| Baby Boomers | 41% | 30% |
| Gen X | 30% | 30% |
| Millennials | 21% | 34% |
Source: Federal Reserve and Census Bureau. Age 29 is used as the cutoff because the youngest Millennials—the latest generation in the data—are 29 in 2025. Numbers may not sum to 100 due to rounding.
On the other hand, Baby Boomers own an outsized proportion of property relative to their share of the population that is 29 and older.
Baby Boomers have benefited from buying at a time when homes were more affordable. And, in one study, a third of Baby Boomers who own their home say they’ll never sell. With the older generation aging in place, it may take time for younger generations to climb the real estate ladder.
![]()
Stay in tune with your company’s spending with Terzo’s AI-powered financial platform.
More from Terzo
-
Business7 days ago
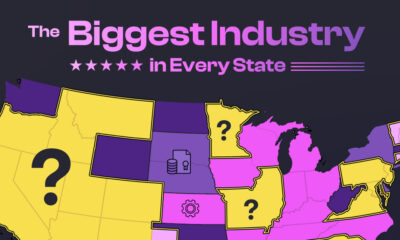
America’s Economic Engines: The Biggest Industry in Every State
Real estate is the biggest industry by GDP in 26 states. Find out why it dominates—and what fuels the rest of the country.
-
Maps3 weeks ago
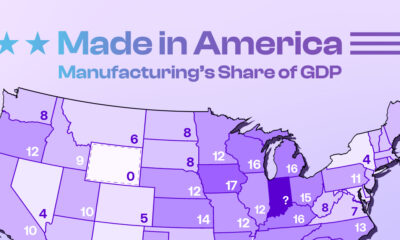
Mapped: Manufacturing as a Share of GDP, by U.S. State
Tariffs are rising to boost American-made goods. Which states gain the most—and least—from manufacturing today?
-

Technology1 month ago
Profit Powerhouses: Ranking The Top 10 U.S. Companies by Net Income
Collectively, the ten most profitable U.S. companies have a net income of $684 billion—more than the entire GDP of Belgium.
-

Money1 month ago
Millionaire Hubs: Mapping the World’s Wealthiest Cities
New York City has the highest millionaire population globally. Which other cities attract the world’s wealthiest?
-
Economy1 month ago
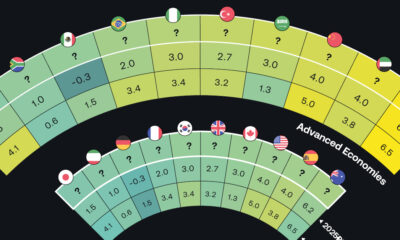
Tomorrow’s Growth: GDP Projections in Key Economies
The global economy is expected to have slighter slower growth going forward. Which countries are on track to have the biggest GDP increases?
-

Money3 months ago
Mapped: Interest Rates by Country in 2025
The U.S. has kept their target rate the same at 4.25-4.50%. What do interest rates look like in other countries amid economic uncertainty?
-
Markets4 months ago
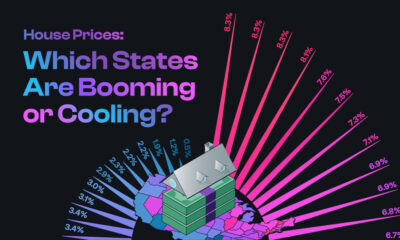
U.S. Housing Prices: Which States Are Booming or Cooling?
The national housing market saw a 4.5% rise in house prices. This graphic reveals which states had high price growth, and which didn’t.
-
Investor Education4 months ago
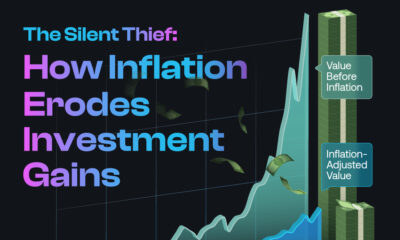
The Silent Thief: How Inflation Erodes Investment Gains
If you held a $1,000 investment from 1975-2024, this chart shows how the inflation rate can drastically reduce the value of your money.
-

Politics5 months ago
Trade Tug of War: America’s Largest Trade Deficits
Trump cites trade deficits—the U.S. importing more than it exports—as one reason for tariffs. Which countries represent the largest deficits?
Subscribe
Please enable JavaScript in your browser to complete this form.Join the 375,000+ subscribers who receive our daily email *Sign Up