![]()
See this visualization first on the Voronoi app.
Use This Visualization
Mapped: U.S. Manufacturing Jobs by State
This was originally posted on our Voronoi app. Download the app for free on iOS or Android and discover incredible data-driven charts from a variety of trusted sources.
President Trump has championed the idea that a key part of making America great again is bringing back industries that left the country in recent decades. With his tariff-driven trade policy, the White House has promoted “Made in America” as a way to create jobs and boost the economy.
Based on April 2025 data from the Bureau of Labor Statistics, this map highlights the U.S. states leading and lagging in manufacturing employment.
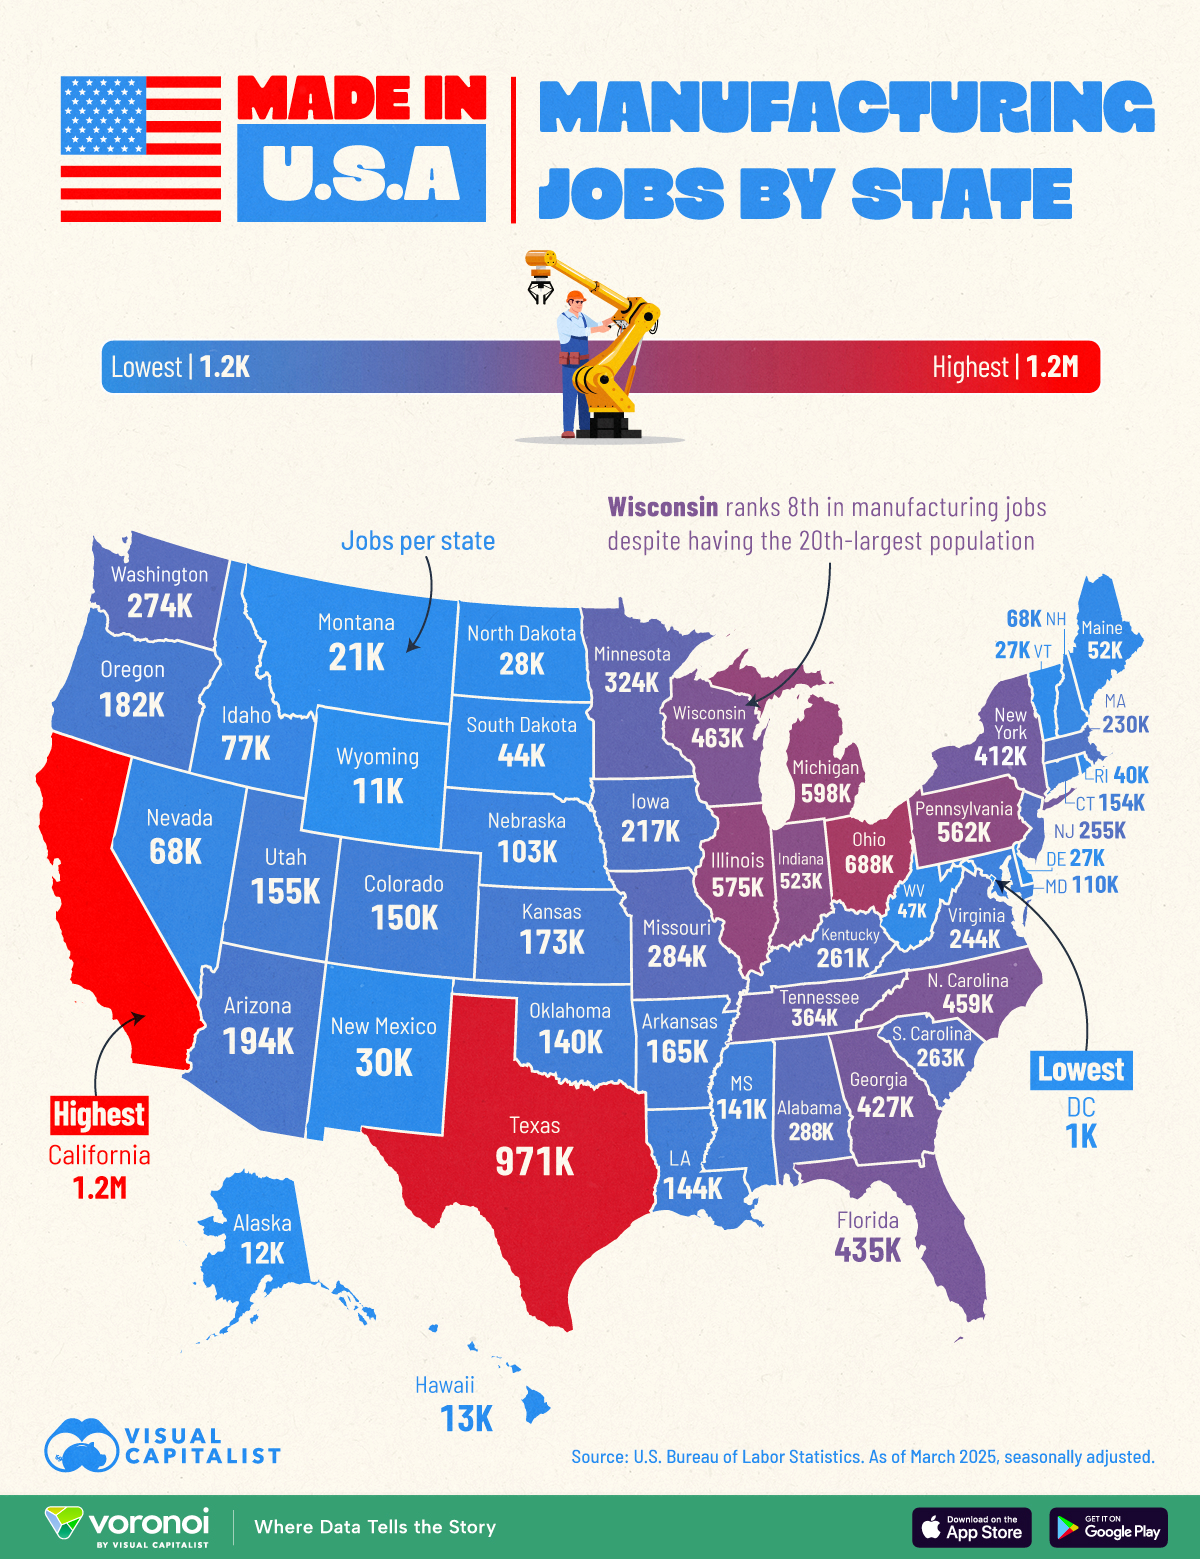
California Leads in Manufacturing
Manufacturing remains geographically diverse across the U.S., with major hubs on both coasts and in the interior.
In terms of absolute numbers, California leads the nation, with 1.22 million manufacturing jobs. Texas follows with 970,600 jobs, while Ohio and Michigan maintain their traditional industrial strength with 687,500 and 597,600 jobs, respectively.
| State | Manufacturing Jobs | Jobs per 100k |
|---|---|---|
| California | 1,222.9K | 3094.0 |
| Texas | 970.6K | 3101.9 |
| Ohio | 687.5K | 5785.4 |
| Michigan | 597.6K | 5893.2 |
| Illinois | 574.7K | 4521.6 |
| Pennsylvania | 561.5K | 4293.2 |
| Indiana | 523.3K | 7557.5 |
| Wisconsin | 462.8K | 7763.8 |
| North Carolina | 459.3K | 4158.1 |
| Florida | 434.6K | 1859.5 |
| Georgia | 426.5K | 3814.5 |
| New York | 412.0K | 2073.8 |
| Tennessee | 364.3K | 5040.3 |
| Minnesota | 323.5K | 5584.2 |
| Alabama | 287.5K | 5574.2 |
| Missouri | 283.9K | 4545.7 |
| Washington | 274.2K | 3445.5 |
| South Carolina | 263.0K | 4800.3 |
| Kentucky | 260.6K | 5679.6 |
| New Jersey | 255.4K | 2688.2 |
| Virginia | 243.5K | 2763.5 |
| Massachusetts | 229.8K | 3220.2 |
| Iowa | 217.2K | 6700.6 |
| Arizona | 193.8K | 2555.9 |
| Oregon | 181.7K | 4252.9 |
| Kansas | 173.0K | 5823.7 |
| Arkansas | 165.0K | 5342.7 |
| Utah | 155.3K | 4432.6 |
| Connecticut | 154.2K | 4195.8 |
| Colorado | 150.1K | 2519.5 |
| Louisiana | 143.8K | 3127.6 |
| Mississippi | 140.8K | 4784.2 |
| Oklahoma | 139.5K | 3406.3 |
| Maryland | 110.4K | 1762.7 |
| Nebraska | 103.3K | 5150.9 |
| Idaho | 77.4K | 3866.9 |
| New Hampshire | 68.2K | 4840.2 |
| Nevada | 67.7K | 2071.9 |
| Maine | 51.7K | 3679.7 |
| West Virginia | 46.7K | 2638.4 |
| South Dakota | 44.3K | 4790.9 |
| Rhode Island | 40.1K | 3605.1 |
| New Mexico | 29.5K | 1384.8 |
| North Dakota | 27.9K | 3502.5 |
| Vermont | 27.2K | 4194.3 |
| Delaware | 26.7K | 2538.2 |
| Montana | 20.8K | 1829.0 |
| Hawaii | 13.1K | 905.9 |
| Alaska | 11.9K | 1607.8 |
| Wyoming | 10.6K | 1803.9 |
| District of Columbia | 1.2K | 170.9 |
Several Southern states have also built strong manufacturing bases. North Carolina (459,300), Georgia (426,500), and Tennessee (364,300) each rank among the top states, supported by industries such as automotive, aerospace, and food processing.
Wisconsin, ranked in the top 10 for total manufacturing employment, stands out for outperforming its size. Although it’s only the 20th most populous state, its manufacturing base remains strong, thanks in part to food and dairy processing. In per capita terms, it’s number one in the nation with 7,763.8 manufacturing jobs for every 100,000 people.
Florida, another top 10 state, has emerged as a growth story. Between 2019 and 2023, the state’s manufacturing employment grew by nearly 10%, highlighting the sector’s expansion in one of the country’s largest economies.
At the other end of the spectrum, Wyoming (10,600 jobs), Alaska (11,900), and Washington, D.C. (1,200) recorded the lowest levels of manufacturing employment. The latter (D.C.) also has the lowest numbers per capita.
Learn More on the Voronoi App ![]()
To learn more about Trump’s impact in his first 100 days, check out this graphic that compares S&P 500 returns during post-WWII presidents’ first 100 days.