
Published
6 seconds ago
on
June 25, 2024
| 9 views
-->
By
Selin Oğuz
Article & Editing
- Ryan Bellefontaine
Graphics & Design
- Jennifer West
The following content is sponsored by National Public Utilities Council
Visualized: The Price of Carbon Around the World
Only 1% of global emissions are priced high enough to meet the Paris Agreement’s temperature target in 2024.
This chart, created in partnership with the National Public Utilities Council, shows carbon prices around the world using data from the World Bank.
Let’s start by looking at what carbon pricing is and how it works.
What Is Carbon Pricing?
Carbon pricing is an environmental strategy aimed at reducing greenhouse gas emissions by assigning a monetary cost to carbon emissions.
The most common types of carbon pricing are emissions trading systems (ETS) and carbon taxes. The former sets an overall emission limit and allocates permits for trading, whereas the latter imposes a fee on emissions to increase their cost and incentivize reductions.
According to the World Bank, Finland and Poland were the first countries to implement a federal carbon price in 1990. The most recent countries, on the other hand, were Australia, Hungary, and Indonesia, implementing carbon pricing in 2023.
Carbon Prices, By Region
In 2017, the Carbon Pricing Leadership Coalition suggested that carbon prices should range from $50–100/tCO2 by 2030 to meet the Paris Climate Agreement’s temperature goal.
Fast forward to 2024, the global average carbon price is $32/tCO2—$18 short of the minimum that is needed in six years.
Carbon pricing varies significantly across different regions. Europe and Central Asia have the highest number of pricing initiatives out of any other world region, with an average price of $50/tCO2.
In the U.S. and Canada, the average price is slightly lower at $48 per ton, with 16 initiatives in place. North America’s approach is characterized by both federal and state/provincial systems, including notable schemes like Canada’s federal carbon pricing and the Regional Greenhouse Gas Initiative in the United States.
| Region | Average Carbon Price | Number of Initiatives |
|---|---|---|
| Europe & Central Asia | $50 | 26 |
| U.S. & Canada | $48 | 16 |
| Latin America & Caribbean | $24 | 11 |
| East Asia & Pacific | $11 | 18 |
| Africa | $10 | 1 |
The European Union’s ETS system was introduced in 2005. The initiative led to a 16% decrease in covered emissions between 2022 and 2023 and generated $47 billion. Several EU member countries have also implemented their own carbon pricing mechanisms to address sectors outside the EU ETS’s scope or to generate domestic revenue.
While there are notable efforts made in Europe, Central Asia, and North America, the highest carbon tax in the world belongs to Uruguay at $167/tCO2. According to the World Bank, Uruguay’s GDP per capita is $20,795, which is significantly lower than other countries with Paris Agreement-aligned carbon pricing.
Despite these differing initiatives, the global average carbon price still lags behind the levels likely needed to achieve the Paris Agreement targets, emphasizing the potential need for more robust and widespread adoption of carbon pricing to drive meaningful climate action.

Please enable JavaScript in your browser to complete this form.Enjoying the data visualization above? *Subscribe
Related Topics: #greenhouse gas emissions #motive-power #carbon tax #carbon pricing #partner #Carbon price
Click for Comments
var disqus_shortname = "visualcapitalist.disqus.com";
var disqus_title = "Visualized: The Price of Carbon Around the World in 2024";
var disqus_url = "https://www.visualcapitalist.com/sp/visualized-the-price-of-carbon-around-the-world-in-2024/";
var disqus_identifier = "visualcapitalist.disqus.com-167802";
You may also like
-
Environement2 weeks ago
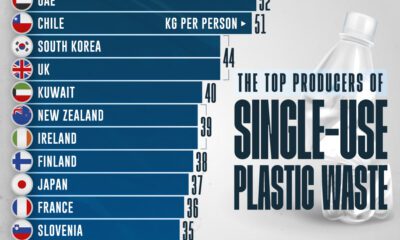
Ranked: Top 20 Countries by Plastic Waste per Capita
Visualizing plastic waste per capita reveals a surprising list of countries that you may not have expected.
-

Culture2 months ago
How People Get Around in America, Europe, and Asia
Examining how people get around using cars, public transit, and walking or biking, and the regional differences in usage.
-

Green2 months ago
The Carbon Footprint of Major Travel Methods
Going on a cruise ship and flying domestically are the most carbon-intensive travel methods.
-

Green2 months ago
Ranking the Top 15 Countries by Carbon Tax Revenue
This graphic highlights France and Canada as the global leaders when it comes to generating carbon tax revenue.
-

Green2 months ago
Ranked: The Countries With the Most Air Pollution in 2023
South Asian nations are the global hotspot for pollution. In this graphic, we rank the world’s most polluted countries according to IQAir.
-

Environment2 months ago
Top Countries By Forest Growth Since 2001
One country is taking reforestation very seriously, registering more than 400,000 square km of forest growth in two decades.
Subscribe
Please enable JavaScript in your browser to complete this form.Join the 375,000+ subscribers who receive our daily email *Sign Up
The post Visualized: The Price of Carbon Around the World in 2024 appeared first on Visual Capitalist.