Visualized: The State of the U.S. Labor Market
This was originally posted on Advisor Channel. Sign up to the free mailing list to get beautiful visualizations on financial markets that help advisors and their clients.
The last time the U.S. labor market was this strong was in 1969.
Unemployment fell to 3.3%, incomes were soaring to historic levels, and inflation was rising at a fast clip. Like today, the Federal Reserve was tightening monetary policy to stifle inflation. Yet much of the wage increases were washed out by rising consumer prices.
The above graphic looks at the industries driving today’s robust job market using data from the Bureau of Labor Statistics. Later, we look into the impact on inflation, and whether today’s market can be sustained.
What is Driving the U.S. Labor Market?
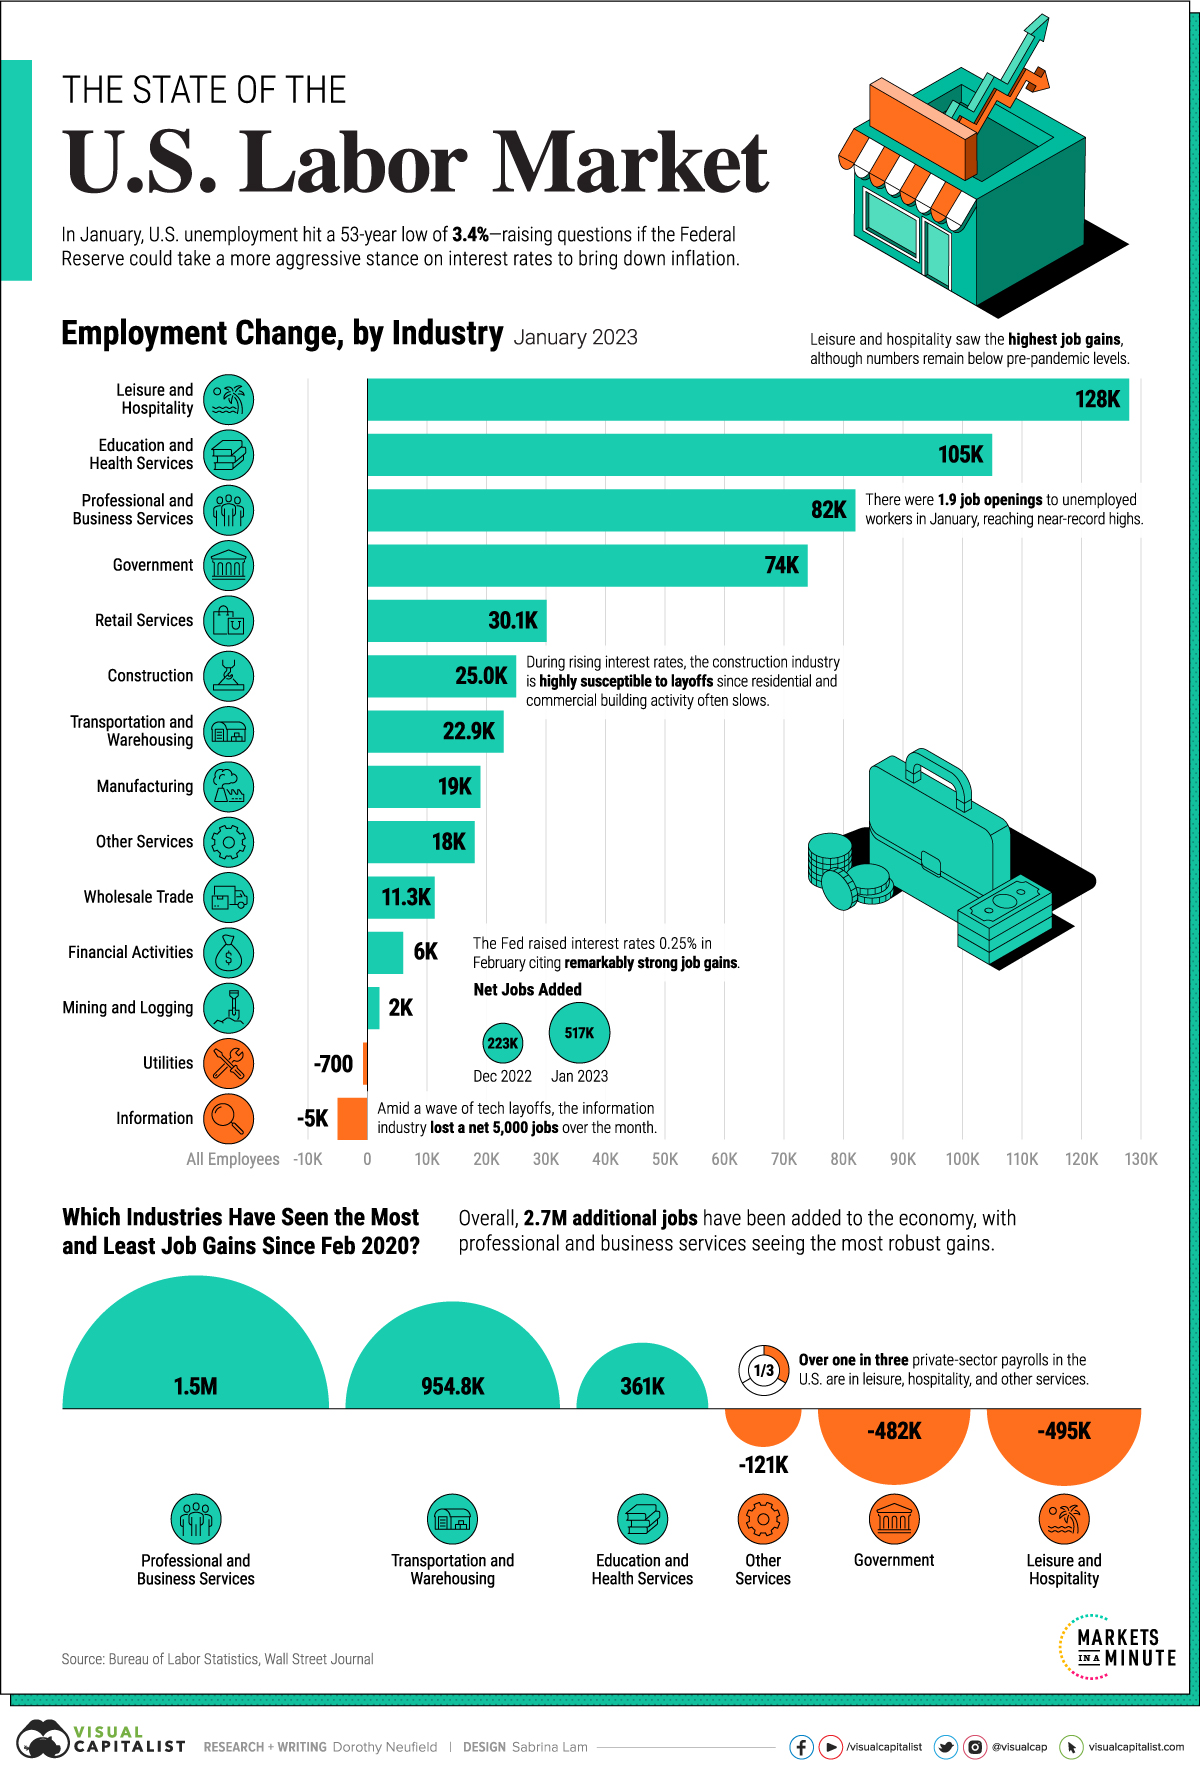
Broadly, service-led industries witnessed the highest share of job growth in January.
Still, as the table below shows, a key part of the services sector—leisure and hospitality employment—remains under pre-pandemic levels. A similar trend is seen in retail services.
| Rank | Industry | Job Growth Jan 2023 | Job Growth Since 2020 |
|---|---|---|---|
| 1 | Leisure and Hospitality | 128K | -495K |
| 2 | Education and Health Services | 105K | 361K |
| 3 | Professional and Business Services | 82K | 1,475K |
| 4 | Government | 74K | -482K |
| 5 | Retail Services | 30K | -37K |
| 6 | Construction | 25K | 276K |
| 7 | Transportation and Warehousing | 23K | 955K |
| 8 | Manufacturing | 19K | 214K |
| 9 | Other Services | 18K | -121K |
| 10 | Wholesale Trade | 11K | 148K |
| 11 | Financial Activities | 6K | 245K |
| 12 | Mining and Logging | 2K | -55K |
| 13 | Utilities | -1K | 8K |
| 14 | Information | -5K | 211K |
Adding 1.5 million jobs since 2020 is professional and business services, the highest overall. This sector covers legal, accounting, veterinary, engineering and other specialized services.
We are also seeing strong gains in transportation and warehousing. Last year, the sector added an average of 23,000 jobs, totaling almost 955,000 over the course of the pandemic. Today, trucking jobs exceed 2019 levels and warehouse employment is roughly 50% higher.
Although manufacturing hasn’t seen the highest gains, the sector has one of the lowest unemployment rates across job sectors, at 2.4%. Yet the industry faces an acute labor shortage—if every skilled unemployed worker were to fill open job vacancies, a third of jobs in durable manufacturing would remain open.
Cooling Wage Growth
Despite rock-bottom unemployment numbers, wage growth is slowing. In January, it fell to 4.4% annually, down from a multi-decade high of 5.9% in March last year.
At the same time, wage growth falls below inflation by about 1%.
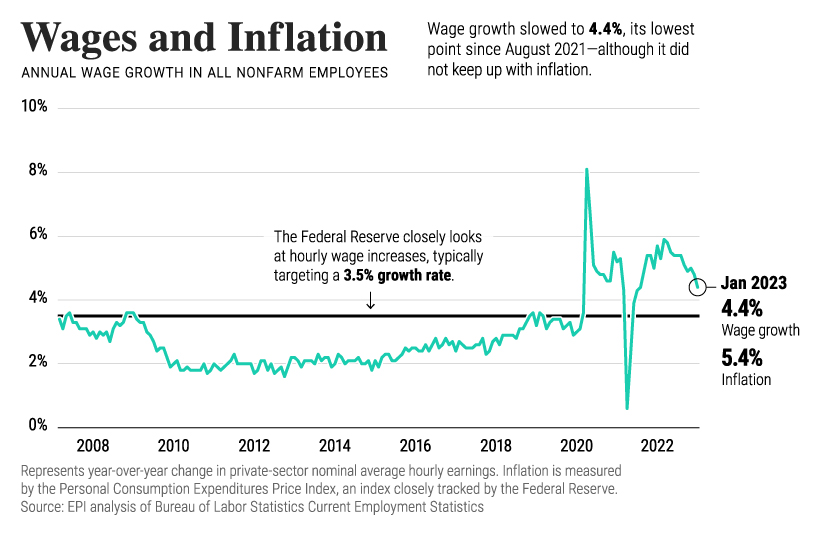
Wage growth is carefully watched by the Federal Reserve. Typically, their annual wage growth target is 3.5% to be compatible with 2% inflation.
In the current environment, this wage growth trend serves as a double-edged sword. As wage growth slows, workers are less likely to see wages keep up with inflation. On the other hand, slower wage growth could help prevent inflation from rising in the first place—and interest rates from climbing higher.
Where is the Job Market Heading?
The question on everyone’s minds is whether today’s job market will stay resilient.
According to Fitch Ratings, slowing aggregate demand in response to higher interest rates will begin to weigh on the U.S. labor market, and the 517,000 new jobs created in January—three times the level expected by analysts— won’t last long.
Eventually, both higher borrowing costs and elevated compensation costs could weigh on corporate profits. On the other hand, the pandemic has changed the labor market. Relief legislation may continue to buoy the job market and workers may also remain scarce as people retire or leave for other reasons.
Given how unemployment serves as a lagging indicator, the material effects in the economy will likely appear before cracks begin to show in the U.S. labor market.
The post Visualized: The State of the U.S. Labor Market appeared first on Visual Capitalist.