
Published
4 seconds ago
on
October 10, 2023
| 19 views
-->
By
Dorothy Neufeld
Graphics & Design
- Alejandra Dander
The following content is sponsored by MSCI


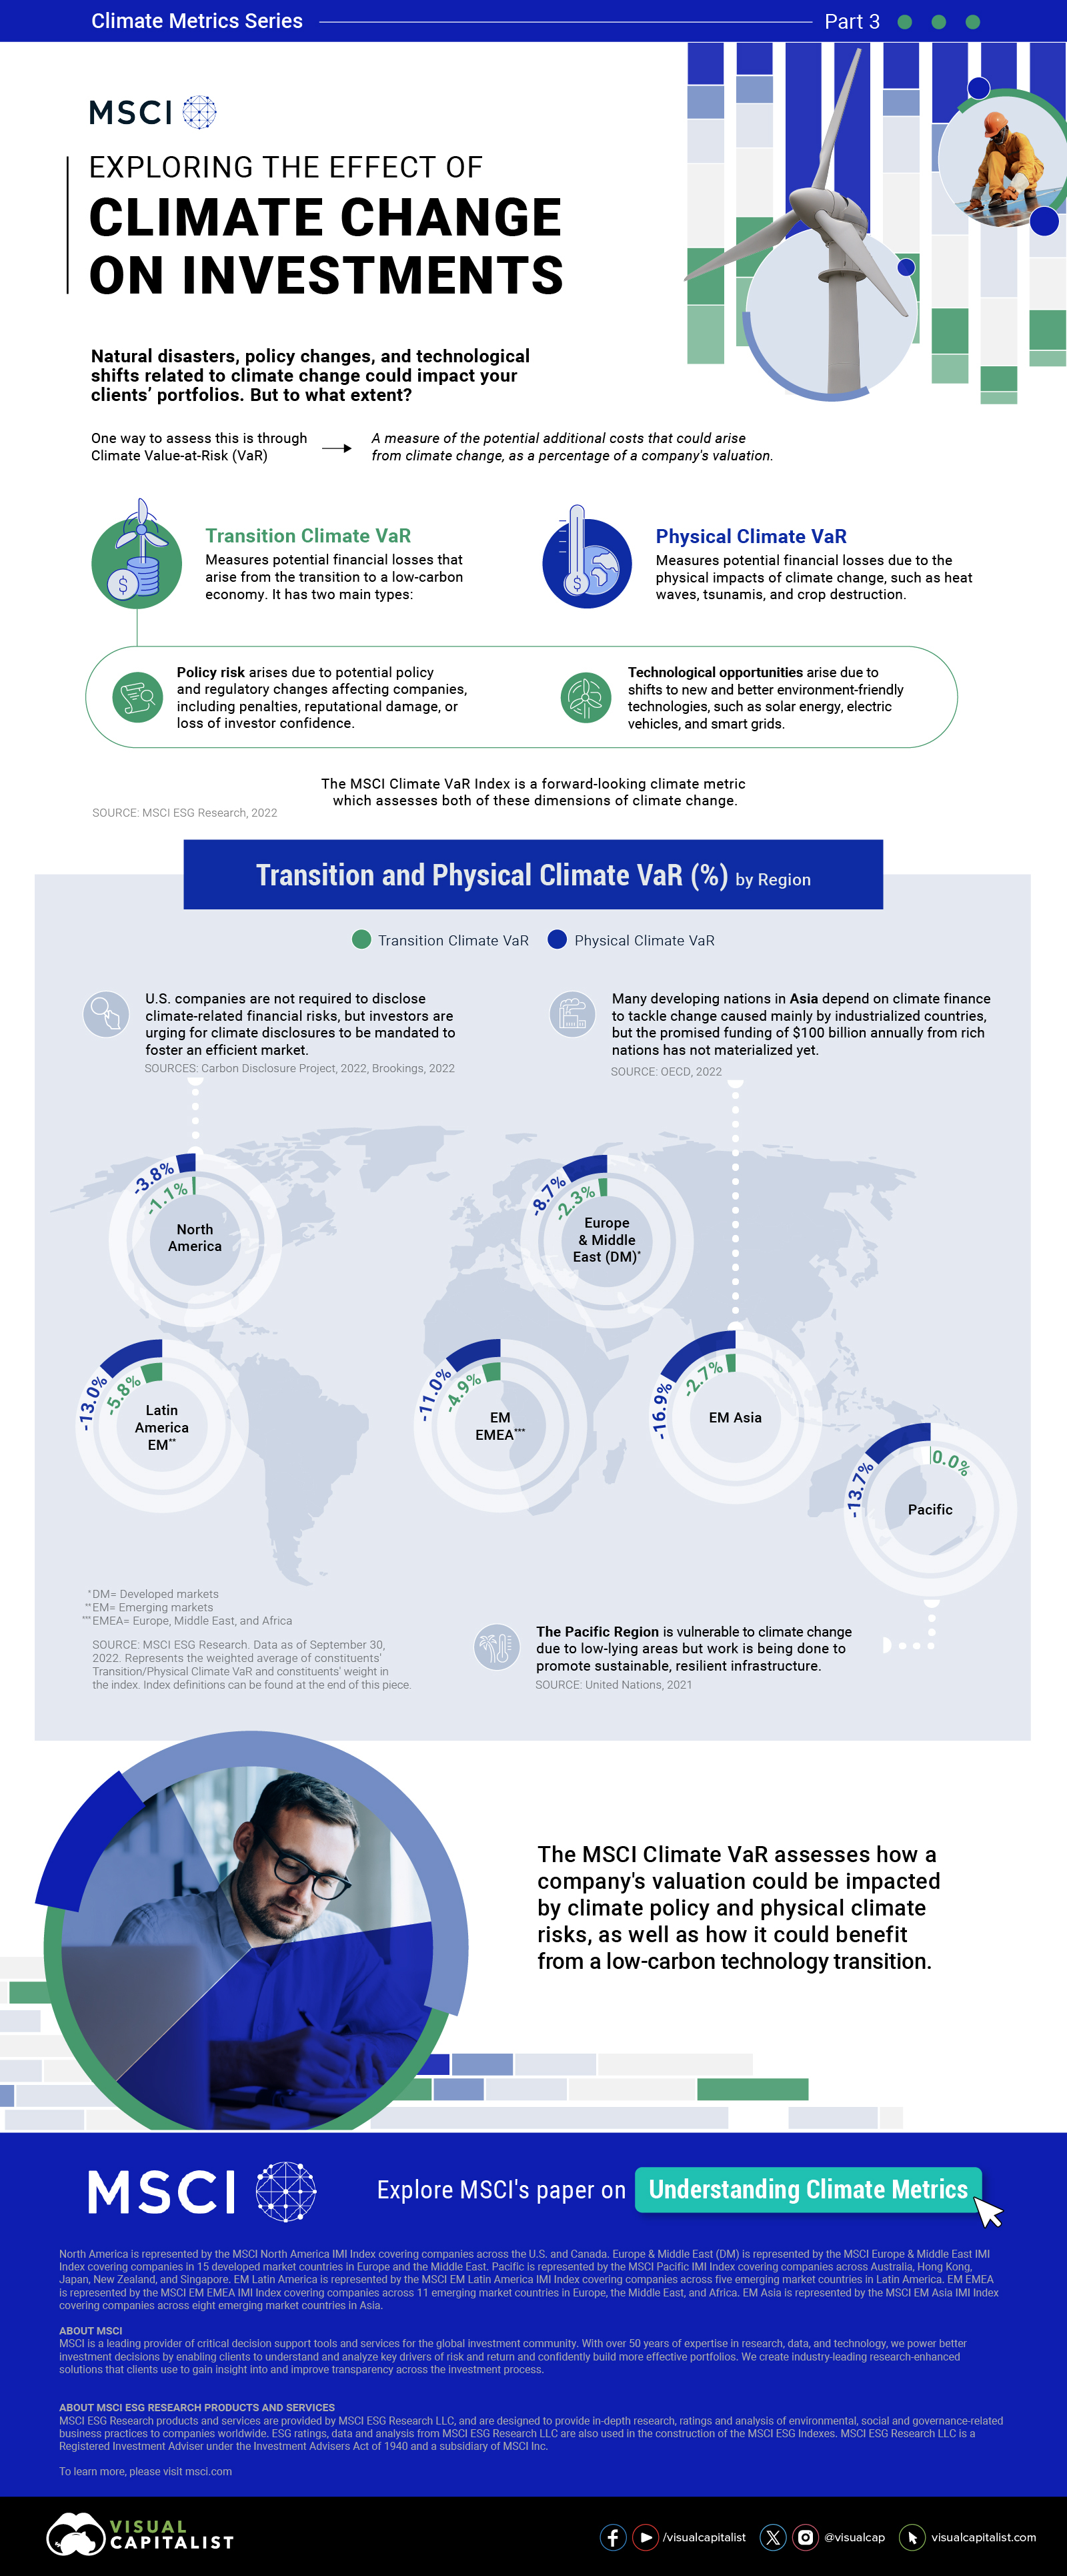
What Are the Climate Risks in a Portfolio?
A warming planet poses clear risks to society. To that end, natural disasters, policy changes, and technological shifts all have the potential to affect an investor’s portfolio. But to what extent?
We partnered with MSCI to explore the effect of climate risk on investments, and how it can be evaluated on a regional basis.
How to Assess Climate Risks
Climate Value-at-Risk (VaR) is a measure of the potential additional costs that could arise from climate change, as a percentage of a company’s valuation, so investors can be better prepared to weather the storm. It assesses two dimensions of climate risk:
1. Transition Climate VaR
This measures potential financial losses from the transition to a low-carbon economy. It has the following categories:
- Policy risk: arises due to potential policy and regulatory changes affecting companies, including penalties, reputational damage, or loss of investor confidence.
- Technological opportunities: arise due to shifts to new and better environmentally-friendly technologies, such as solar energy, electric vehicles, and smart grids.
2. Physical Climate VaR
This measures potential financial losses due to the physical impacts of climate change, such as heat waves, tsunamis, and crop failures.
For instance, the Pacific region, including Australia and New Zealand, is highly vulnerable to climate change given that it’s home to a number of low-lying islands.
Climate Risk, by Region
Climate risks can vary by region due to a range of factors, from climate policy to climate conditions, including increased likelihood of wildfires or flooding.
Below, we show a regional breakdown of Climate VaR. These represent the weighted average of constituents in the following MSCI indexes as of September 30, 2022. The greater the negative VaR, the greater the potential downside risk.
| Region | Transition Climate VaR | Physical Climate VaR |
|---|---|---|
| Europe & Middle East (DM)* | -2.3% | -8.7% |
| EM** Asia | -2.7% | -16.9% |
| EM EMEA*** | -4.9% | -11.0% |
| EM Latin America | -5.8% | -13.0% |
| North America | -1.1% | -3.8% |
| Pacific | +0.0% | -13.7% |
*Developed markets. **Emerging markets. ***Europe, Middle East, and Africa. Pacific region countries include Australia, Hong Kong, Japan, New Zealand and Singapore.
Given how climate risks have the potential to affect a portfolio’s value, it pays to be proactive. The MSCI Climate VaR assesses how a company’s valuation could be impacted by climate policy and physical climate risks, as well as how it could benefit from a low-carbon technology transition.
![]()
Explore MSCI’s paper on Understanding Climate Metrics.

Please enable JavaScript in your browser to complete this form.Enjoying the data visualization above? *Subscribe
Related Topics: #climate change #msci #climate metrics #tranistion risks
Click for Comments
var disqus_shortname = "visualcapitalist.disqus.com";
var disqus_title = "Visualized: What Are the Climate Risks in a Portfolio?";
var disqus_url = "https://www.visualcapitalist.com/sp/visualized-what-are-the-climate-risks-in-a-portfolio/";
var disqus_identifier = "visualcapitalist.disqus.com-161456";
You may also like
-
Green15 hours ago
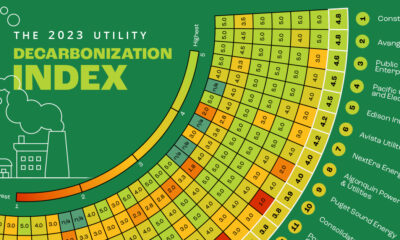
The 2023 Utility Decarbonization Index
Here’s a preview of the 2023 Utility Decarbonization Index, which tracks the decarbonization progress of the largest U.S. utilities.
-

Green1 week ago
Ranked: The Most Carbon-Intensive Sectors in the World
Comparing average Scope 1 emission intensities by sector according to an analysis done by S&P Global Inc.
-
Environment2 months ago
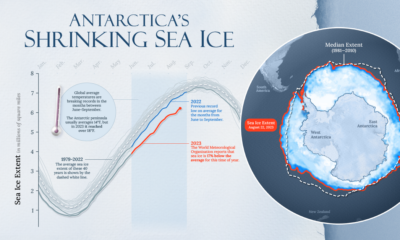
Tracking Antarctica Sea Ice Loss in 2023
Antarctica’s ice extent has reached record lows. This visual details and maps Antarctica sea ice loss over the last two years.
-

History2 months ago
The Anthropocene: A New Epoch in the Earth’s History
We visualize Earth’s history through the geological timeline to reveal the planet’s many epochs, including the Anthropocene.
-

Green2 months ago
Visualizing the Global Population by Water Security Levels
This chart highlights the different countries, and the number of people, facing water security issues around the world.
-
Green3 months ago
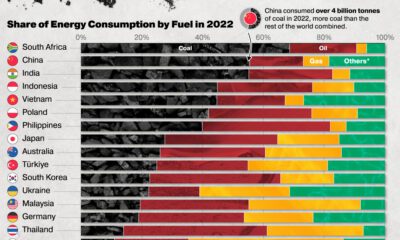
Which Countries Are Most Reliant on Coal?
Global consumption of coal surpassed 8 billion tonnes per year for the first time in 2022. Here are the countries using the most coal.
Subscribe
Please enable JavaScript in your browser to complete this form.Join the 375,000+ subscribers who receive our daily email *Sign Up
The post Visualized: What Are the Climate Risks in a Portfolio? appeared first on Visual Capitalist.