![]()
See this visualization first on the Voronoi app.
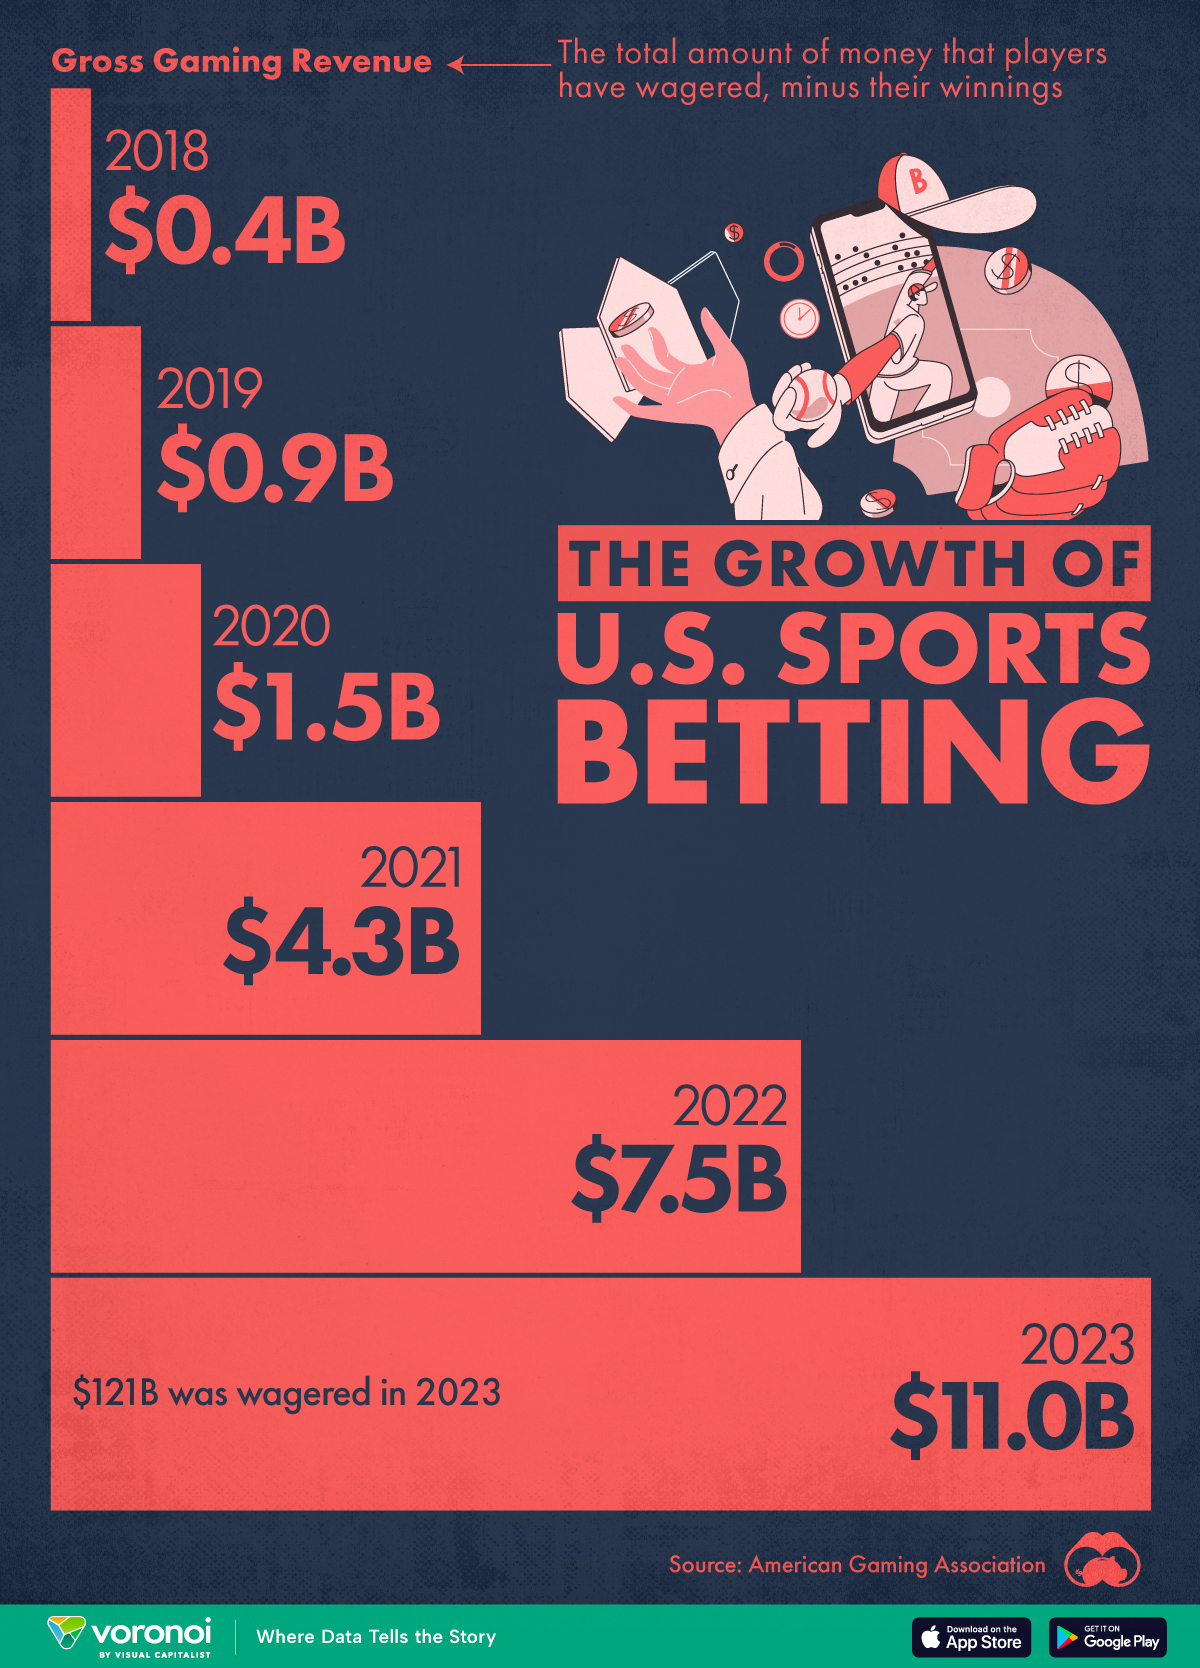
Visualizing the Growth of U.S. Sports Betting
This was originally posted on our Voronoi app. Download the app for free on iOS or Android and discover incredible data-driven charts from a variety of trusted sources.
The global sports betting industry has grown exponentially over the last few years, with a significant share of that growth coming from the United States.
This graphic shows annual gross gaming revenue (GGR) from sports betting in the U.S., with data coming from the American Gaming Association.
What is GGR?
GGR is the total amount of money wagered minus winnings. For example, if a player wagers $1,000,000 at a casino and wins $900,000, GGR would be $100,000.
Sports Betting Still a Young Industry
Sports betting in the U.S. was first legalized in May 2018, after the Supreme Court struck down the Professional and Amateur Sports Protection Act (PASPA) of 1992. PASPA had effectively outlawed sports betting nationwide.
Since 2018, gross gaming revenue has jumped from $400 million to $11 billion in 2023.
| Year | Gross Gaming Revenue (GGR) | Label |
|---|---|---|
| 2018 | 0.4 | $0.4B |
| 2019 | 0.9 | $0.9B |
| 2020 | 1.5 | $1.5B |
| 2021 | 4.3 | $4.3B |
| 2022 | 7.5 | $7.5B |
| 2023 | 11.0 | $11.0B |
Betting is particularly big in Nevada, New Jersey, and Pennsylvania due to early legalization, robust regulatory frameworks, and strong sports cultures.
Nevada, boosted by Las Vegas, generated over $5 billion in commercial gaming revenue (including other casino revenue streams) over the first four months of 2024, while New Jersey and Pennsylvania each generated over $2 billion.
According to the American Gaming Association, 38 states (and DC) have legalized sports betting to date.
If you enjoyed this post, be sure to check out this graphic, which shows the top NFL teams by revenue.
The post Visualizing the Growth of U.S. Sports Betting appeared first on Visual Capitalist.