Written By Govind Bhutada
Graphics & Design
- Pernia Jamshed
Published August 12, 2022
•
Updated August 12, 2022
•
TweetShareShareRedditEmail

The following content is sponsored by Surge Battery Metals
The New Era of Energy
Energy is the pulse of our daily lives, powering everything from our homes to our cars and electronic gadgets.
Over the last two decades, there’s been an ongoing shift in how we produce and consume energy, largely due to rising climate awareness among both governments and consumers.
The above infographic from Surge Battery Metals highlights the increasing uptake of clean energy technologies and explains the need for the raw materials that power them. This is part two of three infographics in the Energy Independence Series.
The Growth of Clean Energy
Government policies, falling production costs, and climate consciousness have all contributed to the exponential adoption of green energy technologies.
For example, only a few countries were actively encouraging EV adoption a decade ago, but today, millions of consumers can take advantage of EV tax concessions and purchase subsidies with governments committed to phasing out internal combustion engines. Partly as a result, electric vehicles (EVs) are well on their way to mainstream adoption.
Here’s a look at how the number of electric cars on the road has grown since 2011, including both battery EVs and plug-in hybrids:
| Country/Region | 2011 Electric Car Stock | 2021 Electric Car Stock |
|---|---|---|
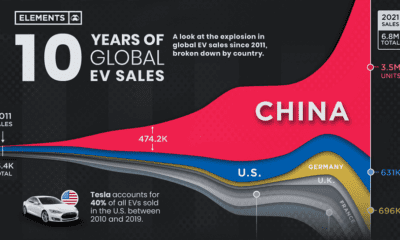
| China | 10,000 | 7,800,000 |
| Europe | 20,000 | 5,500,000 |
| U.S. | 20,000 | 2,000,000 |
| Other | 20,000 | 1,100,000 |
| Total | 70,000 | 16,400,000 |
In 2021, the global electric car stock stood at around 16.4 million cars, up by around 60% from 2020. EV sales also more than doubled to reach 6.8 million units.
Alongside electric cars, renewable energy technologies are also on the road to dominating the global energy mix. In 2021, renewables accounted for 16% of global energy consumption—up from just 8% in 2000. This growth is largely down to solar and wind energy, which made up the majority of new renewable capacity additions:
| Year | Net Renewable Capacity Additions (gigawatts) |
Solar PV % Share |
Wind % Share |
|---|---|---|---|
| 2011 | 109.4 | 28% | 36% |
| 2012 | 116.4 | 25% | 40% |
| 2013 | 122.9 | 30% | 27% |
| 2014 | 135.1 | 30% | 37% |
| 2015 | 159.7 | 31% | 42% |
| 2016 | 171.3 | 44% | 30% |
| 2017 | 174.8 | 55% | 27% |
| 2018 | 179.3 | 54% | 28% |
| 2019 | 193.8 | 56% | 31% |
| 2020 | 280.2 | 48% | 40% |
| 2021 | 288.9 | 54% | 31% |
Every year since 2018, solar and wind have accounted for more than 80% of new renewable capacity additions, contributing to the record-breaking growth of clean energy.
Despite this growth, the IEA projects that both EVs and renewables need to expand their reach significantly if the world is to achieve net-zero emissions by 2050. Electric car sales need to hit 56 million units by 2030—more than eight times the 6.6 million cars sold in 2021. Similarly, solar PV and wind additions need to quadruple by 2030 from 2021 levels.
This new era of clean energy will require an increase in the supply of EVs, solar panels, wind turbines, and batteries, which translates into more demand for the unnoticed raw materials behind these technologies.
The Metals Behind Clean Energy
From copper in cables to lithium in batteries, some metals are key to building and growing clean energy capacity.
In fact, for every megawatt of capacity, solar photovoltaic farms use more than 2,800 kg of copper according to the IEA. Offshore wind farms, which are connected to land by massive undersea cables, use even more copper at 8,000 kg per megawatt. Similarly, electric cars use lithium-ion batteries, which are composed of a variety of minerals, including graphite, copper, nickel, and lithium.
While the demand for these clean energy minerals is skyrocketing, their supply remains a concern, with China dominating the supply chains. In the new era of energy, domestic supplies of these materials will be key to ensuring energy independence and lower reliance on foreign imports.
In the next part of the Energy Independence Series sponsored by Surge Battery Metals, we will explore how the U.S. can build an Energy-Independent Future by developing domestic raw material and battery supply chains.

Please enable JavaScript in your browser to complete this form.Subscribe to our free newsletter and get your mind blown on a daily basis: *Sign up
Related Topics: #renewable energy #solar #clean energy #electric vehicles #fossil fuels #energy transition #wind energy #surge-battery-metals
Click for Comments
var disqus_shortname = "visualcapitalist.disqus.com";
var disqus_title = "Visualizing the New Era of Energy";
var disqus_url = "https://www.visualcapitalist.com/sp/new-era-of-energy/";
var disqus_identifier = "visualcapitalist.disqus.com-151690";
You may also like
-
Misc44 mins ago
Brand Loyalty is Declining for Most Luxury Automakers
Brand loyalty has declined for most luxury automakers, but three brands—Tesla, Maserati, and Genesis—appear to have bucked the trend.
-

Demographics1 day ago
Ranked: The Most and Least Livable Cities in 2022
Which cities rank as the best places to live worldwide? This map reveals the world’s most and least livable cities.
-

Markets3 days ago
Visualizing Major Layoffs At U.S. Corporations
This infographic highlights the accelerating pace of layoffs so far in 2022, as businesses cut costs ahead of a potential recession.
-
Energy4 days ago
Visualizing 10 Years of Global EV Sales by Country
Global EV sales have grown exponentially, more than doubling in 2021 to 6.8 million units. Here’s a look at EV sales by country since 2011.
-

Science1 week ago
Visualizing the Relationship Between Cancer and Lifespan
New research links mutation rates and lifespan. We visualize the data supporting this new framework for understanding cancer.
-
Energy1 week ago
Which Countries Produce the Most Natural Gas?
Natural gas prices have risen since Russia’s invasion of Ukraine. This visualization highlights the world’s largest natural gas producers.
Subscribe
Please enable JavaScript in your browser to complete this form.Join the 300,000+ subscribers who receive our daily email *Sign Up
The post Visualizing the New Era of Energy appeared first on Visual Capitalist.