Published
20 mins ago
on
December 20, 2023
| 47 views
-->
By
Dorothy Neufeld
Graphics & Design
- Alejandra Dander
The following content is sponsored by New York Life Investments
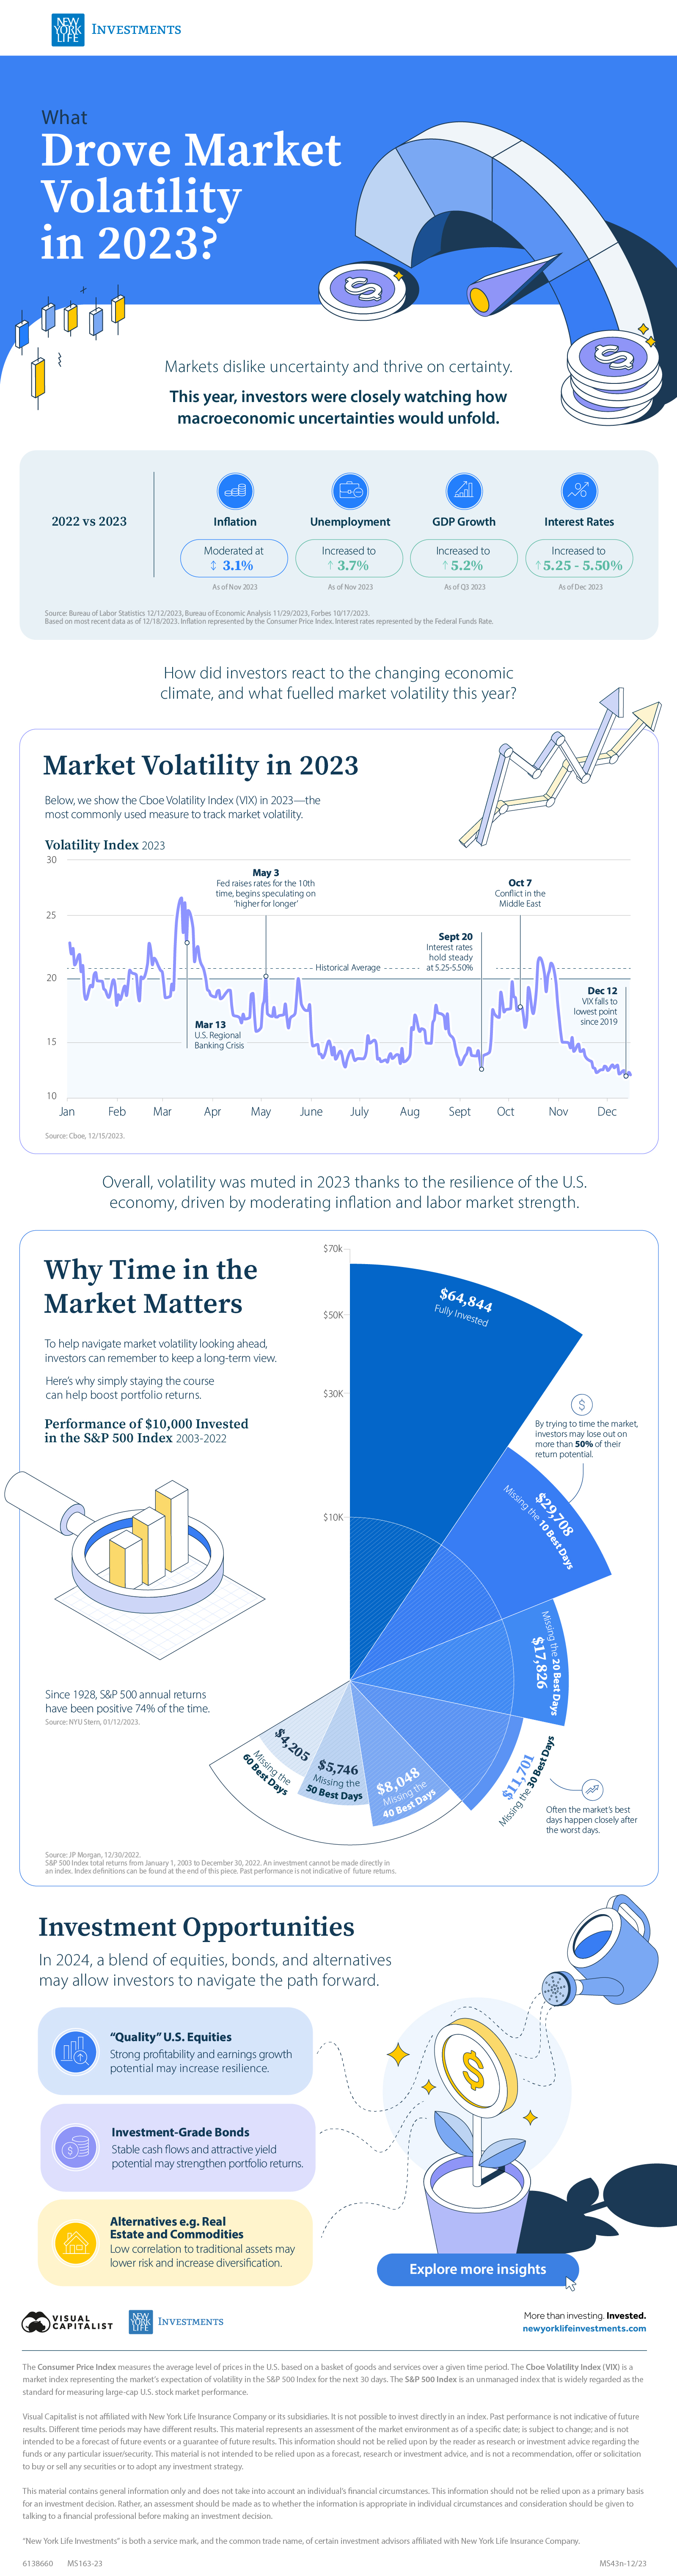
What Drove Market Volatility in 2023?
Market volatility was notably calm over 2023—in a striking contrast from last year.
In fact, the Cboe Volatility Index (VIX), a common measure for tracking volatility, dropped to four-year lows in December after the Fed signaled interest rate cuts in 2024.
This graphic, sponsored by New York Life Investments, shows the key factors that influenced volatility this year and how to navigate the path forward.
The Macroeconomic Climate
To start, investors were closely watching how macroeconomic uncertainties would unfold in 2023. Here’s how they compared to last year:
| Indicator | 2022 vs 2023 | Level | Date |
|---|---|---|---|
| Inflation | Moderated | 3.1% | Nov 2023 |
| Unemployment Rate | Increased | 3.7% | Nov 2023 |
| GDP Growth | Increased | 5.2% | Q3 2023 |
| Interest Rates | Increased | 5.25 - 5.50% | Dec 2023 |
How did investors react to the shifting economic climate, and did this cause volatility to spike?
Looking Back at Market Volatility
In 2023, moderating inflation, solid consumer spending, and labor market strength tempered investor fear, leading volatility to fall.
Yet there were a few noteworthy spikes. During the U.S. regional banking crisis in March, the VIX jumped above 30 amid heightened investor panic about bank profitability. Later in May, volatility spiked again after the Fed raised rates for the 10th time as it began speculating on ‘higher for longer’ rate scenarios.
After this point, volatility dropped significantly. Inflation had fallen for five consecutive months, hitting an annual low of 3% in June, down from 6.4% in January.
It was not until the growing conflict in the Middle East in October that volatility jumped—but following strong economic data in December, the VIX hit 12.1, its lowest point since late 2019.
Why Time in the Market Matters
While some argue that volatility could remain muted, others suggest it could increase again in 2024, citing an overheated market and credit market strains.
To help navigate market volatility looking ahead, investors can remember to keep a long-term view. Consider the hypothetical performance of an investor who stayed invested in the market versus missing out on its best days:
| Performance of $10,000 Invested in the S&P 500 Index2003-2022 | Annual Return | |
|---|---|---|
| Fully Invested | $64,844 | +9.8% |
| Missing the 10 Best Days | $29,708 | +5.6% |
| Missing the 20 Best Days | $17,826 | +2.9% |
| Missing the 30 Best Days | $11,701 | +0.8% |
| Missing the 40 Best Days | $8,048 | -1.1% |
| Missing the 50 Best Days | $5,746 | -2.7% |
| Missing the 60 Best Days | $4,205 | -4.2% |
As the above table shows, by trying to time the market, investors may lose out on more than 50% of their return potential.
Not only that, the market’s best days often happen closely after the worst days. The good news is that since 1928, S&P 500 annual returns have been positive 74% of the time, reinforcing the value of sticking it out through market swings.
Investment Opportunities
In 2024, a blend of equities, bonds, and alternatives may allow investors to navigate volatility:
- “Quality” U.S. Equities: Strong profitability and earnings growth potential may increase resilience.
- Investment-Grade Bonds: Stable cash flows and attractive yield potential may strengthen returns.
- Alternatives e.g. Real Estate and Commodities: Low correlation to traditional assets may lower risk and increase diversification.
Together, a balanced portfolio may help capture return potential in the year ahead.
![]()
Explore more investment insights with New York Life Investments.

Please enable JavaScript in your browser to complete this form.Enjoying the data visualization above? *Subscribe
Related Topics: #vix #market volatility #us interest rates #NYLI #New York Life Investments #2023 inflation
Click for Comments
var disqus_shortname = "visualcapitalist.disqus.com";
var disqus_title = "What Drove Market Volatility in 2023?";
var disqus_url = "https://www.visualcapitalist.com/sp/market-volatility-in-2023/";
var disqus_identifier = "visualcapitalist.disqus.com-163104";
You may also like
-

Markets1 day ago
Top 10 Stocks on Instagram and TikTok
Which stocks are the most talked about online? Here are the top 10 stocks on Instagram and TikTok by content created about their shares.
-

Markets2 days ago
Who Are America’s Most Popular CEOs?
Social network Blind polled 13,000+ respondents on whether they approved or disapproved of the way their CEO handled the job, generating the approval rating of more…
-

Markets4 days ago
Ranked: Share of Million-Dollar Homes in U.S. Cities
We highlight the top 15 U.S. metro areas by their percentage of million-dollar homes, from San Francisco to Miami.
-
Markets6 days ago
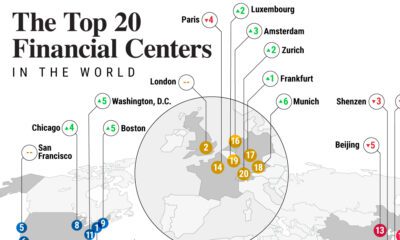
Mapped: The Top Global Financial Centers in 2023
Where are the leading global financial centers in today’s evolving economic landscape? Here are the top commerce hubs in 2023.
-
Markets6 days ago
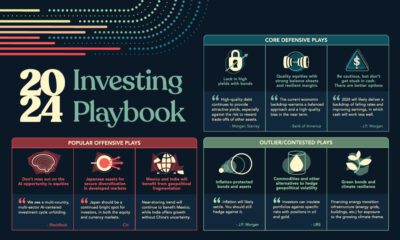
The Investment Playbook for 2024: Visualized
As top institutions advise for cautious deployment of capital next year, what assets and strategies are in their investing playbook in 2024?
-

Money1 week ago
Charted: IMF Forecasts for International Interest Rates
Which economies are expected to see interest rates rise, or fall? We highlight IMF forecasts for international interest rates through 2028.
Subscribe
Please enable JavaScript in your browser to complete this form.Join the 375,000+ subscribers who receive our daily email *Sign Up
The post What Drove Market Volatility in 2023? appeared first on Visual Capitalist.