Submitted by Wolf Richter via WolfStreet.com,
“Some very critical things are hidden.”
After the white-knuckle sell-off of global equities that was finally punctuated by a rally late last week, everyone wants to know: Was this the bottom for stocks? And now Moody’s weighs in with an unwelcome warning.
If you want to know where equities are going, look at junk bonds, it says. Specifically, look at the spread in yield between junk bonds and Treasuries. That spread has been widening sharply. And look at the Expected Default Frequency (EDF), a measure of the probability that a company will default over the next 12 months. It has been soaring.
They do that when big problems are festering: The Financial Crisis was already in full swing before the yield spread and the EDF reached today’s levels!
And so, John Lonski, chief economist at Moody’s Capital Markets Research, has a dose of reality for stock-market bottom fishers:
For now, it’s hard to imagine why the equity market will steady if the US high-yield bond spread remains wider than 800 basis points [8 percentage points]. Taken together, the highest average EDF metric of US/Canadian non-investment-grade companies of the current recovery and its steepest three-month upturn since March 2009 favor an onerous high-yield bond spread of roughly 850 basis points.
Moody’s EDF began spiking last summer and has nearly doubled since then to 8%, the highest since 2009.
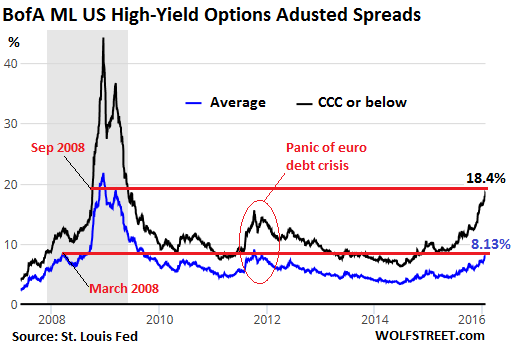
The average spread between high-yield bonds and Treasuries has widened to 813 basis points (8.13 percentage points). But at the lower end of the junk-bond spectrum (rated CCC and below), the yield spread is a red-hot 18.4 percentage points.
This chart shows the average high-yield spread (blue line) and the CCC-and-below spread (black line). Note how far we were already into the Financial Crisis before both spreads reached the today’s levels: March 13, 2008, and September 30, 2008, respectively:
So how does the yield spread impact equities and the broader economy?
A wider-than 800 basis-point high-yield spread reflects elevated risk aversion that will reduce capital formation and spending by non-investment-grade businesses. In addition, ultra-wide bond yield spreads favor a continuation of equity market volatility that should sap the confidence of businesses and consumers.
Which has consequences for stock prices.
Yield Spreads and EDF sink M&A.
The premium over market price that acquiring companies pay has been rocket fuel for share price increases in entire sectors as analysts hype the potential for all these companies to receive buyout offers with huge premiums.
Last year, US M&A activity (involving at least one US company) soared to $3.34 trillion, a record 18.6% of US GDP. The prior record was 17.8% of GDP in Q1 2000, just before the dotcom bubble began to implode. The report:
A cresting by M&A may offer valuable insight regarding the state of the business cycle. The two previous yearlong peaks for US company M&A were set in Q3-2007 at $2.213 trillion and in Q1-2000 at $1.745 trillion. Recessions struck within one year of each of those peaks.
But the markets didn’t wait for those official recessions. Stocks began their multi-year crash at the end of those quarters!
The buyout frenzy is funded in part by large amounts of debt. As corporations lever up, risks rise and downgrades hail down on them. In 2015, M&A-related “net downgrades” (difference between M&A-related downgrades and upgrades) by Moody’s rose to 36. This year, Moody’s expects them to increase further.
The M&A activity last year was fueled by low borrowing costs, high stock market valuations, and “diminished prospects for organic revenue growth,” as Moody’s put it euphemistically: S&P 500 companies waded through four quarters in a row of revenue declines!
The importance of the latter helps to explain why record highs for M&A tend to occur close to the end of a business cycle upturn. The urge to merge will be greater the more convinced corporations are of the imperative to meet long-term earnings targets via mergers, acquisitions, or divestitures.
M&A is the easy way to growth. But it comes at a high price, increased financial instability, subsequent downsizing and cost-cutting, and slow-moving waves of layoffs that then sap consumer demand and the economy.
Yield spreads and EDF sink share buybacks.
“In order to supply a more immediate lift to shareholder returns,” Lonski writes, companies lower total shares outstanding by buying back their own shares. This lowers the dilution that occurs when they issue new shares for M&A and executive compensation. These financial engineering tactics have been another type of rocket fuel underneath the market.
“A more uncertain earnings outlook,” as the report euphemistically calls the ongoing three-quarter earnings recession for S&P 500 companies, “will increase the incentive” to engage in share buybacks “as opposed to investing such funds in a company’s production capabilities.”
This leads to even more problems:
Sometimes, efforts to enhance shareholder returns trigger credit rating downgrades. Typically, strategies which benefit shareholders at the expense of creditors employ cash- or debt-funded equity buybacks and dividends.
So Moody’s downgrades stemming from “shareholder compensation” rose to 48 in 2015 but were still shy of the record 78 in 2007, at the cusp of the Financial Crisis.
At some point, market volatility, which means downward volatility because no one lambastes upward volatility, will put a damper on M&A and share buybacks, thus knocking over two of the remaining props under the market.
And more ominous still:
The two latest recessions were partly the consequence of markets not knowing the full extent of deteriorations in household and business credit quality. Not everything can be quantified, if only because some very critical things are hidden.
Ah yes, we won’t even really know how bad it is with our over-leveraged corporate heroes until the house of cards comes down to reveal what’s left inside.
But nothing goes to heck in a straight line. Read… After $7.8 Trillion Got Wiped Out in three Weeks, “Global Stocks Surge Most since 2012”