Excerpted from John Hussman's Weekly Market Comment...
...
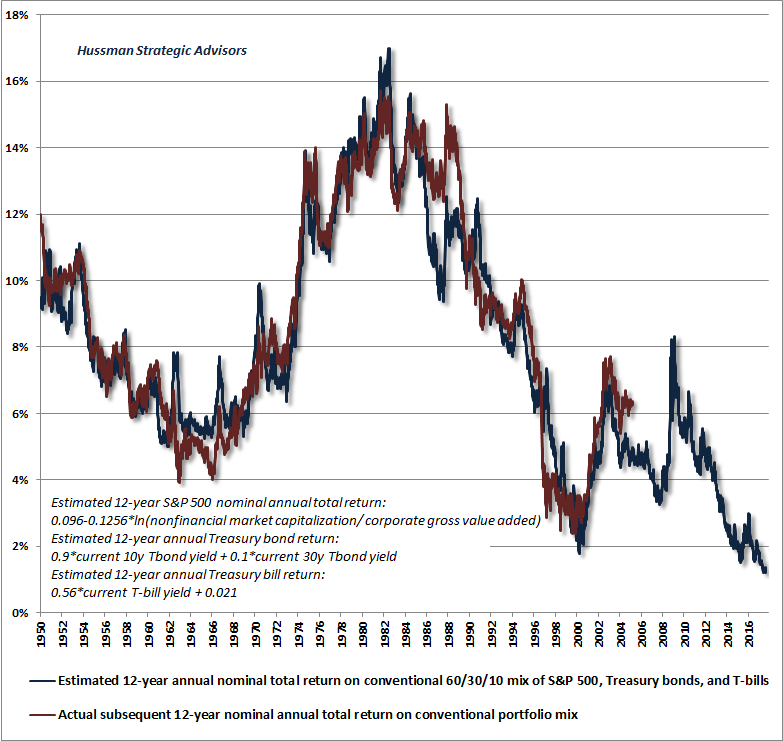
What the “low interest rates justify high valuations” mantra has really done is to ensure that all asset classes are now priced at levels that are likely to generate dismal returns in the coming years. The chart below shows our best estimate of 12-year prospective nominal total returns on a conventional portfolio mix invested 60% in the S&P 500 Index, 30% in Treasury bonds, and 10% in Treasury bills. The red line shows actual subsequent 12-year returns on this mix. The current estimate is only about 1% annually, with the Treasury bond and T-bill components responsible for virtually all of that return, as the expected return on the S&P 500 component is close to zero.
...
What’s often missed in the “low interest rates justify higher valuations” argument is that this proposition assumes that future cash flows and growth rates are held constant. If instead low interest rates emerge as a consequence of low expected nominal growth, valuation multiples should not be affected at all, yet prospective returns will still be lower anyway (you can demonstrate this to yourself by reducing both r and g equally in a basic dividend discount model). To elevate valuation multiples in this situation is to drive prospective returns down twice; a mistaken form of double-counting.
...
The pendulum of speculation has swung far and has grown increasingly grotesque in order to reach this point. It will be a wrecking ball when it returns to earth.
It came in like a wrecking ball!Did not expect that margin call!(apologies to Miley Cyrus)
...
I’ve periodically framed market action from the perspective of Didier Sornette’s model of log-periodic power-law bubbles (see my recent comments in Fair Value and Bubbles: 2017 Edition). Our current best-fit to this structure is presented below. Based on recent market dynamics, I’ve refined the date of the “finite-time singularity” in this model. That “critical point” is not necessarily the date of a peak or the beginning of a crash, but what Sornette describes as “an inflection point from self-reinforcing speculation to fragile instability.” It’s also worth remembering that the “catalysts” associated with sharp market losses have often been fully recognized only after the fact, if at all. As Sornette observes, “The collapse is fundamentally due to the unstable position; the instantaneous cause of the crash is secondary.”
There’s a Wall Street aphorism that one can talk about time, and one can talk about price, but never about both. For that reason, feel free to take the following chart with a grain of salt. From our perspective, we would be inclined to take far more salt if our own measures of valuations, market internals, and overextended conditions were not so hostile as well. As conditions stand, the overall analysis contributes to our general view that the speculative pendulum is dangerously overextended.
In any event, the estimate that best fits recent market dynamics would place the critical point in the first week of August, within less than 2% of current levels. Indeed, the 30-day crash probability that we estimate from this particular model is rising vertically, and will continue to do so with every market advance from this point. In practice, based on a much broader set of historically reliable evidence, we already view the market as highly vulnerable to steep, abrupt losses.
There will be no avoiding the completion of this market cycle for investors in aggregate.