Subscribe to the Advisor Channel free mailing list for more like this
The Risks and Rewards of Timing the Market
This was originally posted on Advisor Channel. Sign up to the free mailing list to get beautiful visualizations on financial markets that help advisors and their clients.
Timing the market seems simple enough: buy when prices are low and sell when they’re high.
But there is clear evidence that market timing is difficult. Often, investors will sell early, missing out on a stock market rally. It can also be unnerving to invest when the market is flashing red.
By contrast, staying invested through highs and lows has generated competitive returns, especially over longer periods.
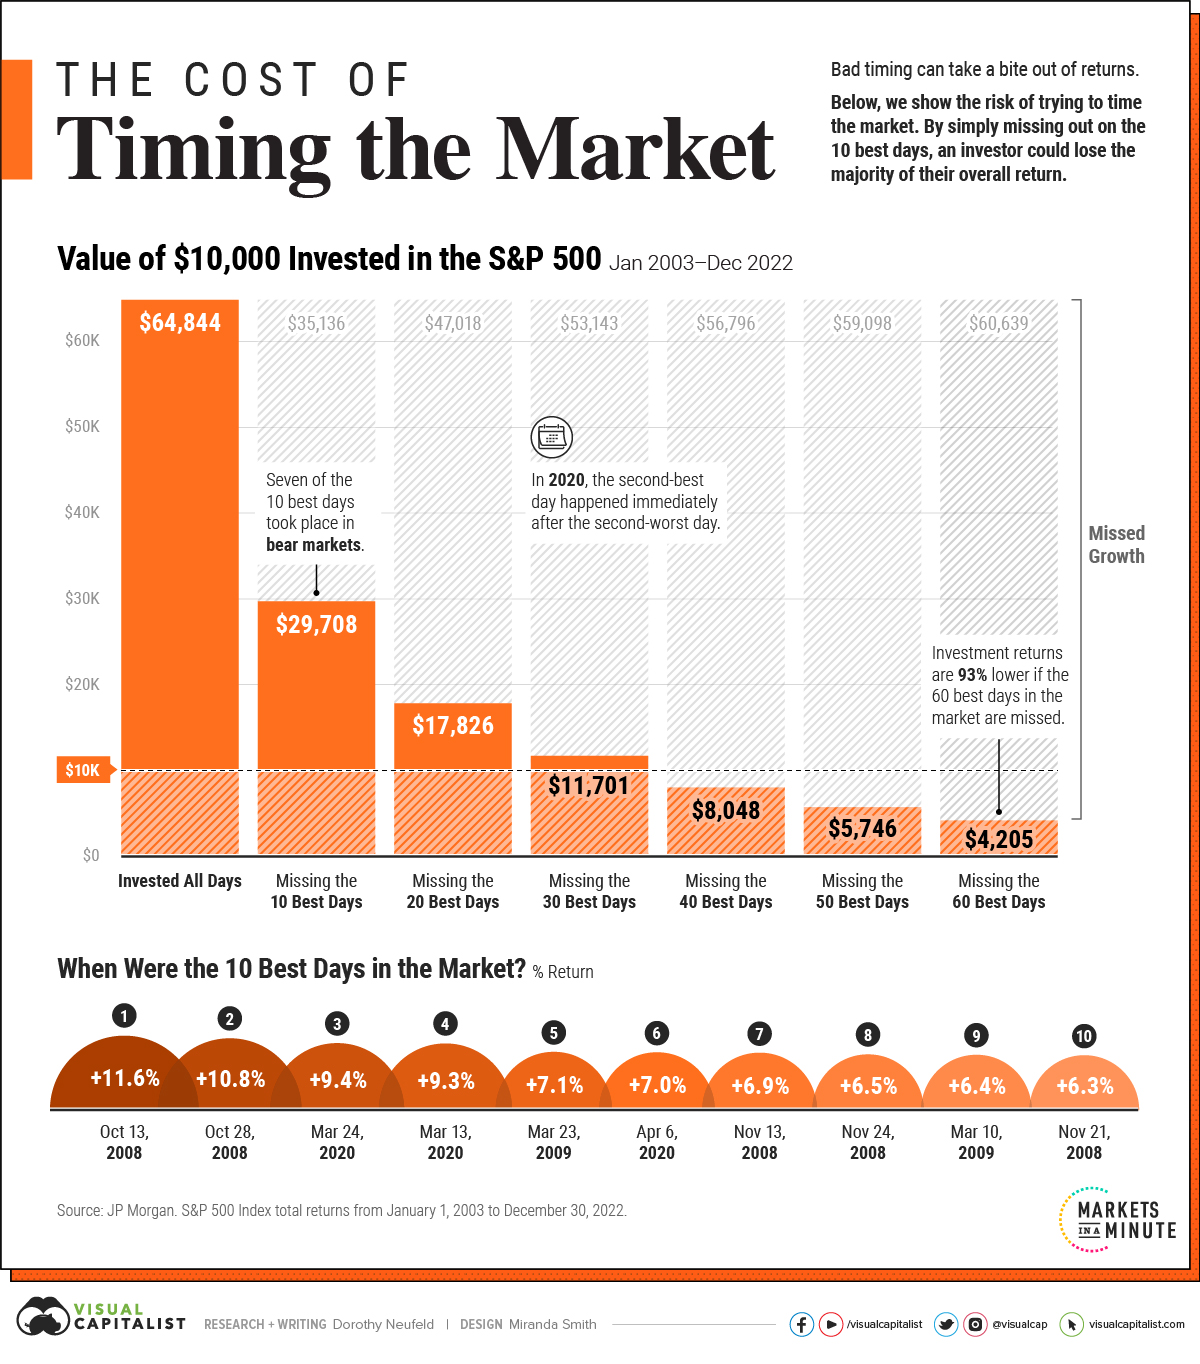
The above graphic shows how trying to time the market can take a bite out of your portfolio value, using 20 years of data from JP Morgan.
The Pitfalls of Timing the Market
Mistiming the market even by just a few days can significantly affect an investor’s returns.
The following scenarios compare the total returns of a $10,000 investment in the S&P 500 between January 1, 2003 and December 30, 2022. Specifically, it highlights the impact of missing the best days in the market compared to sticking to a long-term investment plan.
| Portfolio Value | Annual Return (2003-2022) | |
|---|---|---|
| Invested All Days | $64,844 | +9.8% |
| Missed 10 Best Days | $29,708 | +5.6% |
| Missed 20 Best Days | $17,826 | +2.9% |
| Missed 30 Best Days | $11,701 | +0.8% |
| Missed 40 Best Days | $8,048 | -1.1% |
| Missed 50 Best Days | $5,746 | -2.7% |
| Missed 60 Best Days | $4,205 | -4.2% |
As we can see in the above table, the original investment grew over sixfold if an investor was fully invested for all days.
If an investor were to simply miss the 10 best days in the market, they would have shed over 50% of their end portfolio value. The investor would finish with a portfolio of only $29,708, compared to $64,844 if they had just stayed put.
Making matters worse, by missing 60 of the best days, they would have lost a striking 93% in value compared to what the portfolio would be worth if they had simply stayed invested.
Overall, an investor would have seen almost 10% in average annual returns using a buy-and-hold strategy. Average annual returns entered negative territory once they missed the 40 best days over the time frame.
The Best Days in the Market
Why is timing the market so hard? Often, the best days take place during bear markets.
| Rank | Date | Return |
|---|---|---|
| 1 | Oct 13, 2008 | +12% |
| 2 | Oct 28, 2008 | +11% |
| 3 | Mar 24, 2020 | +9% |
| 4 | Mar 13, 2020 | +9% |
| 5 | Mar 23, 2009 | +7% |
| 6 | Apr 6, 2020 | +7% |
| 7 | Nov 13, 2008 | +7% |
| 8 | Nov 24, 2008 | +7% |
| 9 | Mar 10, 2009 | +6% |
| 10 | Nov 21, 2008 | +6% |
Over the last 20 years, seven of the 10 best days happened when the market was in bear market territory.
Adding to this, many of the best days take place shortly after the worst days. In 2020, the second-best day fell right after the second-worst day that year. Similarly, in 2015, the best day of the year occurred two days after its worst day.
Interestingly, the worst days in the market typically occurred in bull markets.
Why Staying Invested Benefits Investors
As historical data shows, the best days happen during market turmoil and periods of heightened market volatility. In missing the best days in the market, an investor risks losing out on meaningful return appreciation over the long run.
Not only does timing the market take considerable skill, it involves temperament, and a consistent track record. If there were bullet-proof signals for timing the market, they would be used by everyone.
The post Timing the Market: Why It’s So Hard, in One Chart appeared first on Visual Capitalist.