![]()
See this visualization first on the Voronoi app.

Ranked: Top U.S. Companies, by Profit per Employee
This was originally posted on our Voronoi app. Download the app for free on iOS or Android and discover incredible data-driven charts from a variety of trusted sources.
Which companies and industries rake in the most profit per employee?
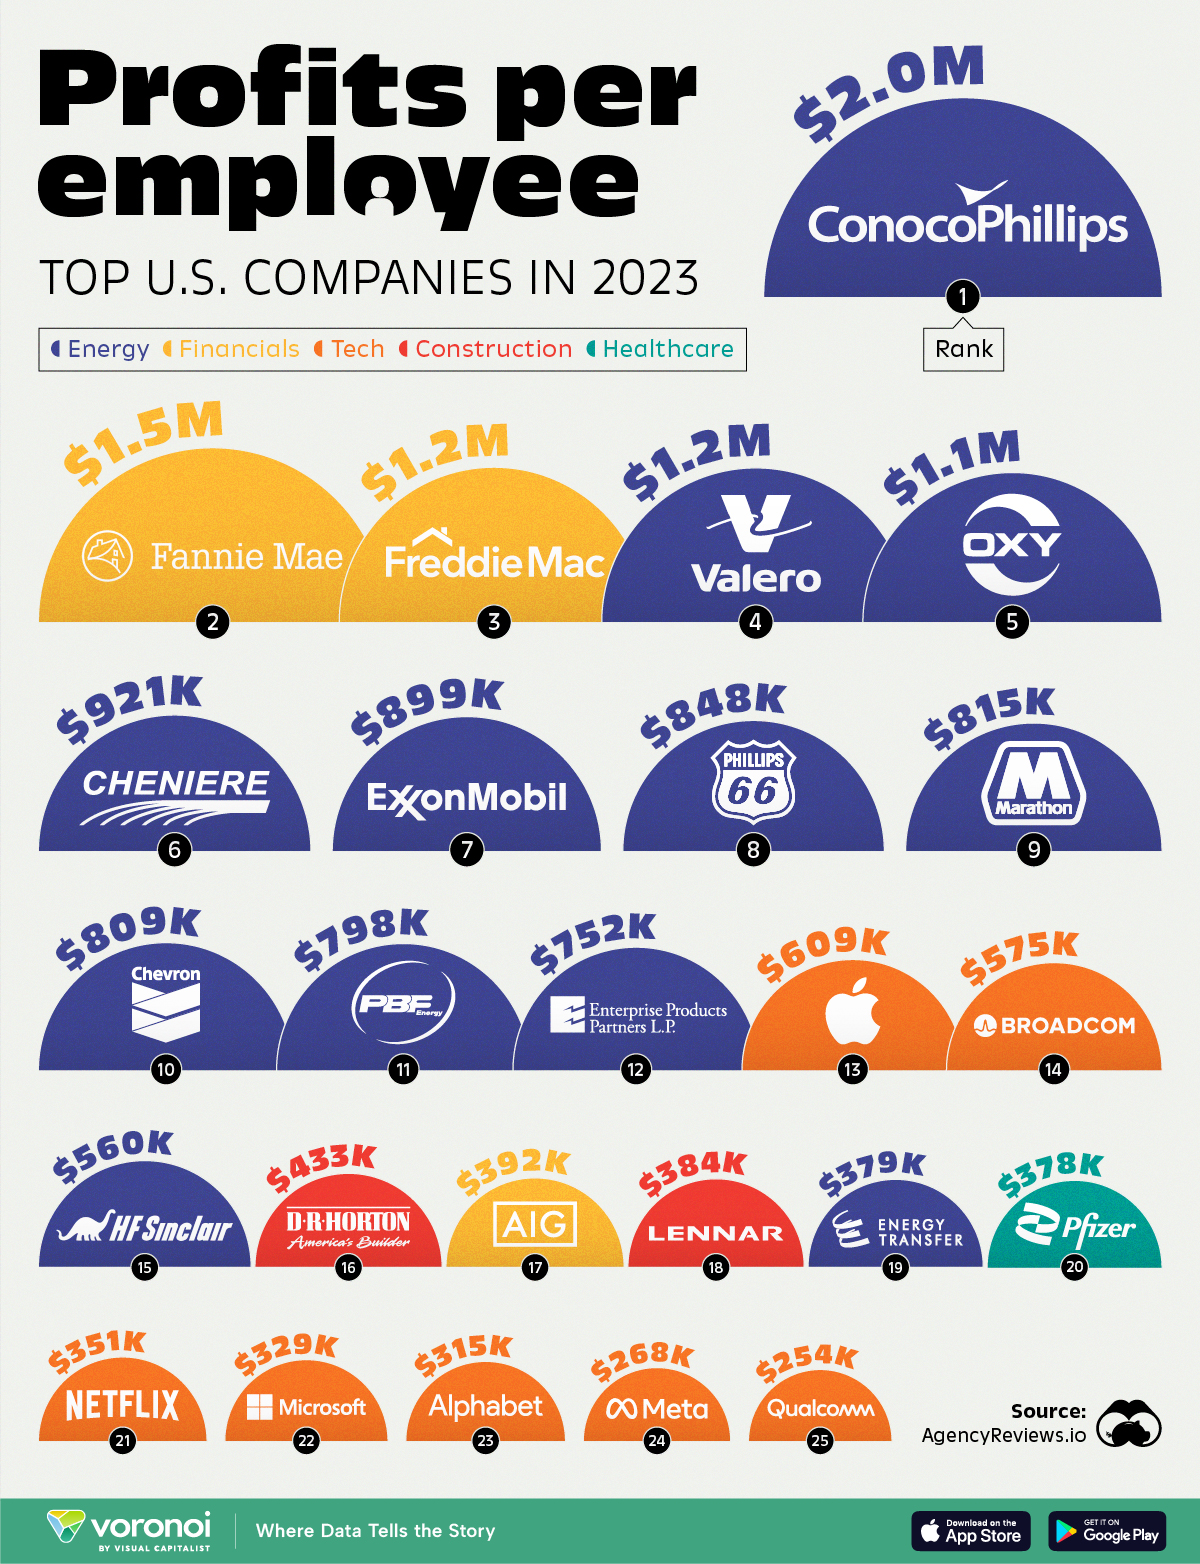
In this graphic, we use data from AgencyReviews.io to rank the top 25 U.S. companies by the profit they generate per employee. The figures come from a December 2023 report.
Why is Profit per Employee Important?
Profit per employee is calculated by dividing a company’s yearly profit by its full-time staff.
Consequently, high profit per employee usually signals financial success, efficient human resource management, and an industry that creates a high amount of leverage per team member.
Energy companies dominate our ranking, suggesting they have relatively small workforces for the amount of money they earn.
| Rank | Company | Industry | Profit per employee |
|---|---|---|---|
| 1 | ConocoPhillips | Energy | $1,970,000 |
| 2 | Fannie Mae | Financials | $1,510,000 |
| 3 | Freddie Mac | Financials | $1,190,000 |
| 4 | Valero | Energy | $1,180,000 |
| 5 | Occidental Petroleum | Energy | $1,110,000 |
| 6 | Cheniere Energy | Energy | $921,000 |
| 7 | ExxonMobil | Energy | $899,000 |
| 8 | Phillips 66 | Energy | $848,000 |
| 9 | Marathon Petroleum | Energy | $815,000 |
| 10 | Chevron | Energy | $809,000 |
| 11 | PBF Energy | Energy | $798,000 |
| 12 | Enterprise Products | Energy | $752,000 |
| 13 | Apple | Tech | $609,000 |
| 14 | Broadcom | Tech | $575,000 |
| 15 | HF Sinclair | Energy | $560,000 |
| 16 | D. R. Horton | Construction | $433,000 |
| 17 | AIG | Financials | $392,000 |
| 18 | Lennar | Construction | $384,000 |
| 19 | Energy Transfer | Energy | $379,000 |
| 20 | Pfizer | Healthcare | $378,000 |
| 21 | Netflix | Tech | $351,000 |
| 22 | Microsoft | Tech | $329,000 |
| 23 | Alphabet | Tech | $315,000 |
| 24 | Meta | Tech | $268,000 |
| 25 | Qualcomm | Tech | $254,000 |
The list includes 12 energy companies (48%), seven tech companies (28%), three finance companies (12%), two construction companies (8%), and one healthcare company (4%).
At the top of the list is ConocoPhillips, one of the world’s largest public energy companies, with operations in over a dozen countries. The company generated almost $2 million in profit per employee with its 9,800 workers.
In second and third places are Fannie Mae and Freddie Mac, government-sponsored enterprises that buy and guarantee mortgages to promote liquidity in the housing market.
Surprisingly, ConocoPhillips generated more than three times the profit per employee compared to the first tech company on the list, Apple (13th).
Traditionally a significant employer, the construction industry is represented by D.R. Horton and Lennar, the two largest homebuilders by volume in the United States.
A Steep Drop From the Top
In total, the top 25 U.S. companies generated a profit of $536.7 billion, with an average profit per employee standing at $490,660.
That said, the top 10 within this cohort boasted an average profit per employee of $1.13 million, while the bottom 10 companies sit at an average of $348,300.
Of course, companies not making the ranking would have even more modest numbers. For example, it’s estimated that Starbucks makes around $80,000 per employee, and Coca-Cola makes around $100,000 per employee.
The post Ranked: Top U.S. Companies, by Profit per Employee appeared first on Visual Capitalist.