![]()
See this visualization first on the Voronoi app.

Use This Visualization
Share of Global Spending by Generation
This was originally posted on our Voronoi app. Download the app for free on iOS or Android and discover incredible data-driven charts from a variety of trusted sources.
While older generations control the largest share of global spending today, Gen Z is on track to become the fastest-growing force in global expenditures over the next decade.
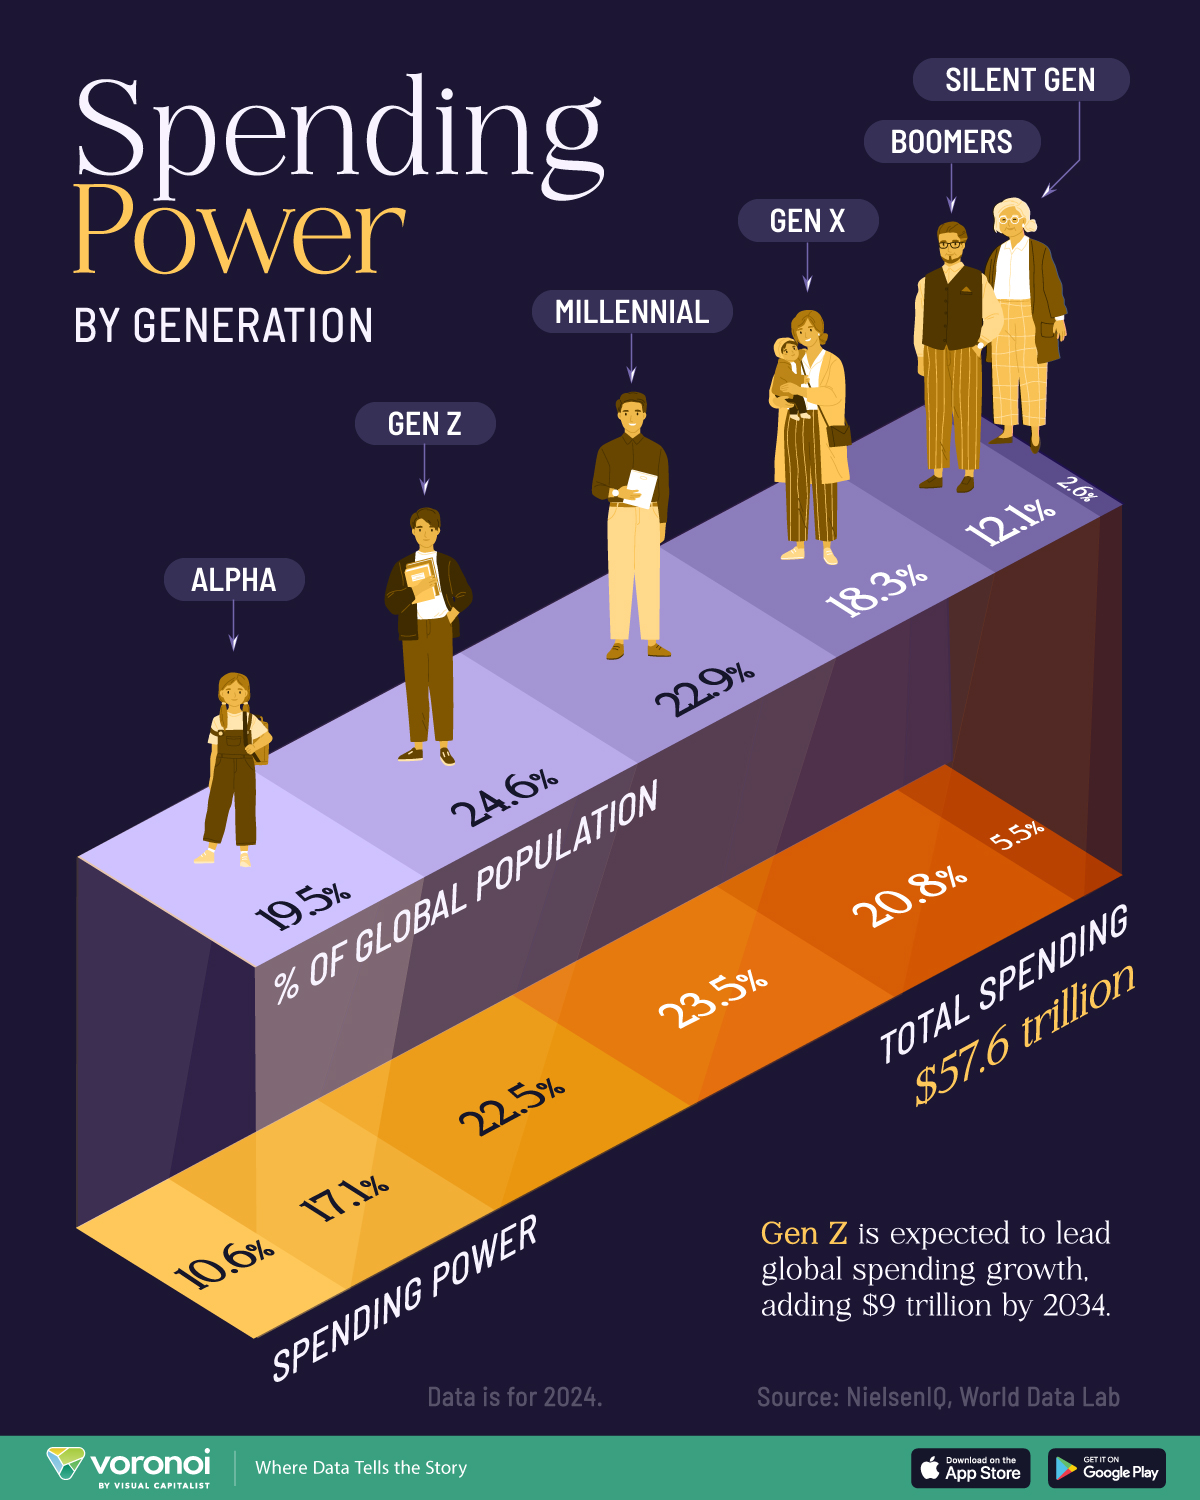
The graphic visualizes the global spending power of each generation (Gen Alpha, Gen Z, Millennial, Gen X, Boomers, and Silent Gen) in 2024, along with each generation’s share of the overall global population.
The data comes from NielsenIQ and World Data Lab’s Spend Z report, and figures shown are in U.S. dollars.
How Much Does Each Generation Spend?
Below, we show the share of global population and spending each generation made up in 2024.
| Generation | Share of population (2024) | Global spending (2024) |
|---|---|---|
| Gen Alpha | 19.5% | 10.6% |
| Gen Z | 24.6% | 17.1% |
| Millennials | 22.9% | 22.5% |
| Gen X | 18.3% | 23.5% |
| Baby Boomers | 12.1% | 20.8% |
| Greatest and Silent Generation | 2.6% | 5.5% |
Older generations, including Gen X, Boomers, and the Silent Generation, all account for a larger share of global spending compared to their share of the population.
Gen X holds the largest share of global spending power at 23.5%. In the U.S., Gen X had an average annual expenditure of $83,357 in 2021—the highest of all the generations.
Millennials follow closely behind with 22.5% of spending power, while representing 22.9% of the population.
However, according to NielsenIQ and World Data Lab, Gen Z is quickly catching up.
The report projects Gen Z will see the fastest growth in spending power in the next 10 years. This generation is expected to add almost $9 trillion in spending globally by 2034, more than any other generation.
According to World Data Lab, Gen Z is “the largest generation to date and will likely be the largest ever.” Today, Gen Z accounts for almost a quarter of the world population.
Learn More on the Voronoi App
To learn more about each generations’ financial habits, check out this graphic that shows how each generation approaches investing.
The post Visualized: Global Spending Power by Generation appeared first on Visual Capitalist.