![]()
See this visualization first on the Voronoi app.
Use This Visualization
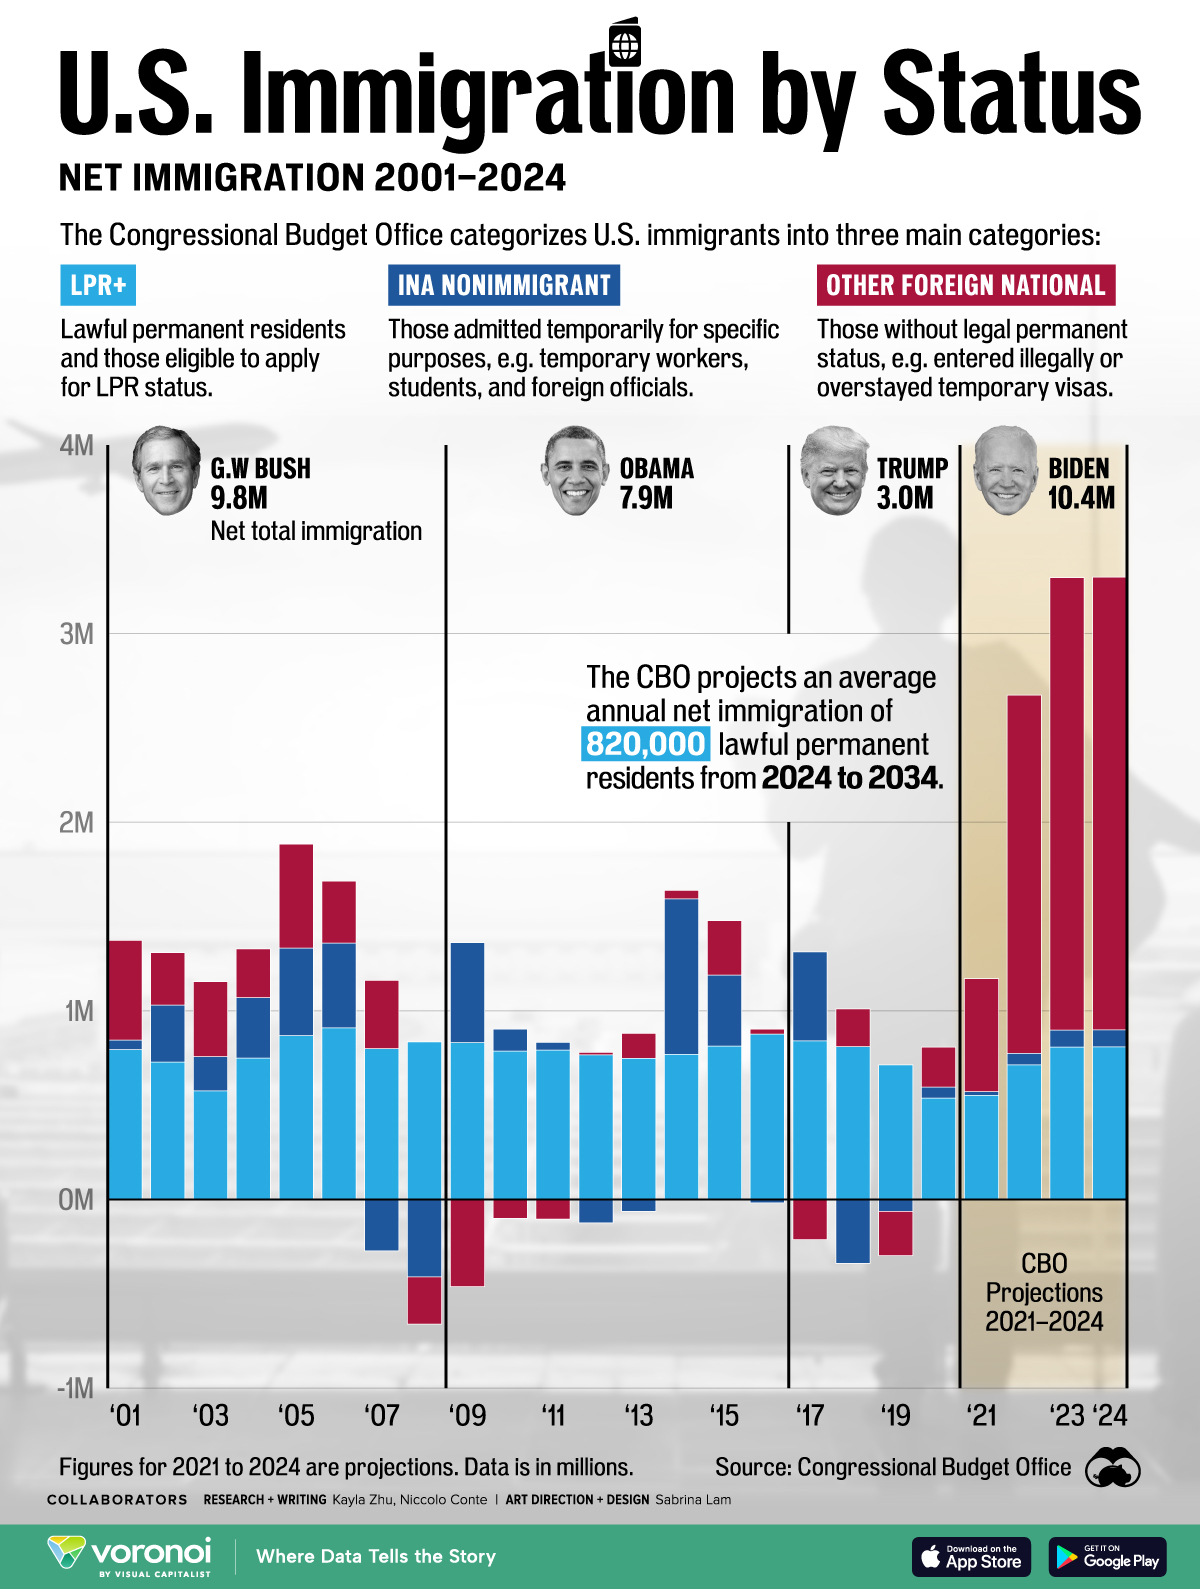
U.S. Net Immigration by President (2001-2024)
This was originally posted on our Voronoi app. Download the app for free on iOS or Android and discover incredible data-driven charts from a variety of trusted sources.
Ahead of the U.S. presidential election, immigration policies are top of mind for American voters. But how has immigration to the U.S. looked over the past two decades across both Republican and Democratic presidencies?
This chart shows net immigration figures in the U.S. from 2001 to 2024, broken down by immigrant status. Data for 2021 to 2024 are projections.
The figures come from a report authored by the Congressional Budget Office (CBO) called Demographic Outlook: 2024 to 2054 with data and projections as of January 2024.
Methodology: How U.S. Immigrants are Categorized
The CBO categorizes immigrants to the United States of America into three groups:
- LPR+: Lawful permanent residents (LPRs) plus people who are eligible to apply to become LPRs on the basis of their current status, such as asylees and refugees. LPRs include those who are granted that status while within the United States as well as people who have gained admission from abroad.
- INA nonimmigrant: Comprises temporary workers, student exchange visitors, qualifying family members, and others admitted as nonimmigrants under the Immigration and Nationality Act (INA)—for example, officials of foreign governments—while they remain in that status.
- Other foreign national: People in the U.S. who are not in the first two categories and who have not subsequently become U.S. citizens or received LPR, asylee, or nonimmigrant status—such as those who entered the U.S. illegally or those who entered legally in a temporary status and then remained after that legal status expired.
Net Immigration to the U.S. from 2001 to 2024, by President
Below, we show net immigration figures for the U.S. from 2001 to 2024, broken down by immigrant type, along with the current U.S. president at the time.
| President | Year | LPR+ | INA nonimmigrant | Other foreign national | Total |
|---|---|---|---|---|---|
| Bush | 2001 | 794,000 | 50,000 | 529,000 | 1,373,000 |
| Bush | 2002 | 728,000 | 302,000 | 278,000 | 1,308,000 |
| Bush | 2003 | 575,000 | 182,000 | 398,000 | 1,155,000 |
| Bush | 2004 | 749,000 | 321,000 | 259,000 | 1,329,000 |
| Bush | 2005 | 869,000 | 463,000 | 552,000 | 1,884,000 |
| Bush | 2006 | 910,000 | 449,000 | 329,000 | 1,688,000 |
| Bush | 2007 | 800,000 | -273,000 | 362,000 | 889,000 |
| Bush | 2008 | 835,000 | -411,000 | -250,000 | 174,000 |
| Obama | 2009 | 832,000 | 529,000 | -462,000 | 899,000 |
| Obama | 2010 | 786,000 | 117,000 | -100,000 | 803,000 |
| Obama | 2011 | 791,000 | 42,000 | -104,000 | 729,000 |
| Obama | 2012 | 766,000 | -125,000 | 13,000 | 654,000 |
| Obama | 2013 | 748,000 | -63,000 | 132,000 | 817,000 |
| Obama | 2014 | 769,000 | 824,000 | 46,000 | 1,639,000 |
| Obama | 2015 | 813,000 | 376,000 | 289,000 | 1,478,000 |
| Obama | 2016 | 877,000 | -18,000 | 26,000 | 885,000 |
| Trump | 2017 | 840,000 | 473,000 | -213,000 | 1,100,000 |
| Trump | 2018 | 810,000 | -339,000 | 200,000 | 671,000 |
| Trump | 2019 | 713,000 | -64,000 | -234,000 | 415,000 |
| Trump | 2020 | 537,000 | 58,000 | 213,000 | 808,000 |
| Biden | 2021 | 551,000 | 20,000 | 600,000 | 1,171,000 |
| Biden | 2022 | 714,000 | 60,000 | 1,900,000 | 2,674,000 |
| Biden | 2023 | 807,000 | 90,000 | 2,400,000 | 3,297,000 |
| Biden | 2024 | 809,000 | 90,000 | 2,400,000 | 3,299,000 |
Overall, net immigration had the biggest increase under current U.S. President Joe Biden’s term. The CBO estimates that for 2021 to 2024 that the U.S. added over 10 million immigrants across all three categories.
During Biden’s term, there has been a significant increase in unauthorized immigration, with border authorities encountering record numbers of migrants at the U.S.-Mexico border.
This surge is attributed to factors such as post-pandemic migration, economic and political instability in countries of origin, and the perception of more lenient policies, leading to over 4.4 million repatriations.
The CBO estimates that net immigration to the U.S. was 2.6 million in 2022 and 3.3 million in both 2023 and 2024, for an estimated 9.27 million net immigrants from 2022-2024—higher than net immigration from 2010 to 2019 which saw 9.19 million immigrants enter the country.
U.S. Immigration Under Donald Trump
Net immigration saw its lowest levels during Trump’s presidency (3 million net immigrants during his term) as the former president enacted 472 administrative changes that impacted U.S. immigration policies.
These include the “Remain in Mexico” policy that required asylum seekers to wait in Mexico for their U.S. immigration hearings, travel bans, significant reductions in refugee admissions and resettlement programs, and the implementation of Title 42 which allowed U.S. officials to turn away migrants who came to the U.S.-Mexico border on the grounds of preventing the spread of COVID-19.
The COVID-19 pandemic also led to a dramatic decline in net immigration to the U.S., with immigration levels dropping to record lows in 2020 due to travel restrictions, consulate closures, and visa processing suspensions, before beginning to recover in 2022.
Learn More on the Voronoi App
To learn more about migration patterns, check out this graphic that visualizes annual net migration by region, from 1950 to 2023.
The post Charted: U.S. Net Immigration, by President (2001-2024) appeared first on Visual Capitalist.