![]()
See this visualization first on the Voronoi app.
Use This Visualization
The Biggest S&P 500 Declines of U.S. Recessions
This was originally posted on our Voronoi app. Download the app for free on iOS or Android and discover incredible data-driven charts from a variety of trusted sources.
The S&P 500 has surged more than 60% from its 2022 lows, driven by a handful of major tech stocks pushing market concentration to multi-decade highs.
Despite this impressive recovery, investors and many other market participants have been worried about a potential recession for the U.S. economy in 2024. Since 1970, U.S. recessions have come with an average peak-to-trough drawdown in the S&P 500 of 36%, and if this decline occurred today it would bring the S&P 500 close to the October lows which marked the 2022 bottom.
But every recession has different economic causes with varying knock-on effects for the stock market, with recessions in the 1980s featuring much smaller declines in the S&P 500 compared to those in the 2000s.
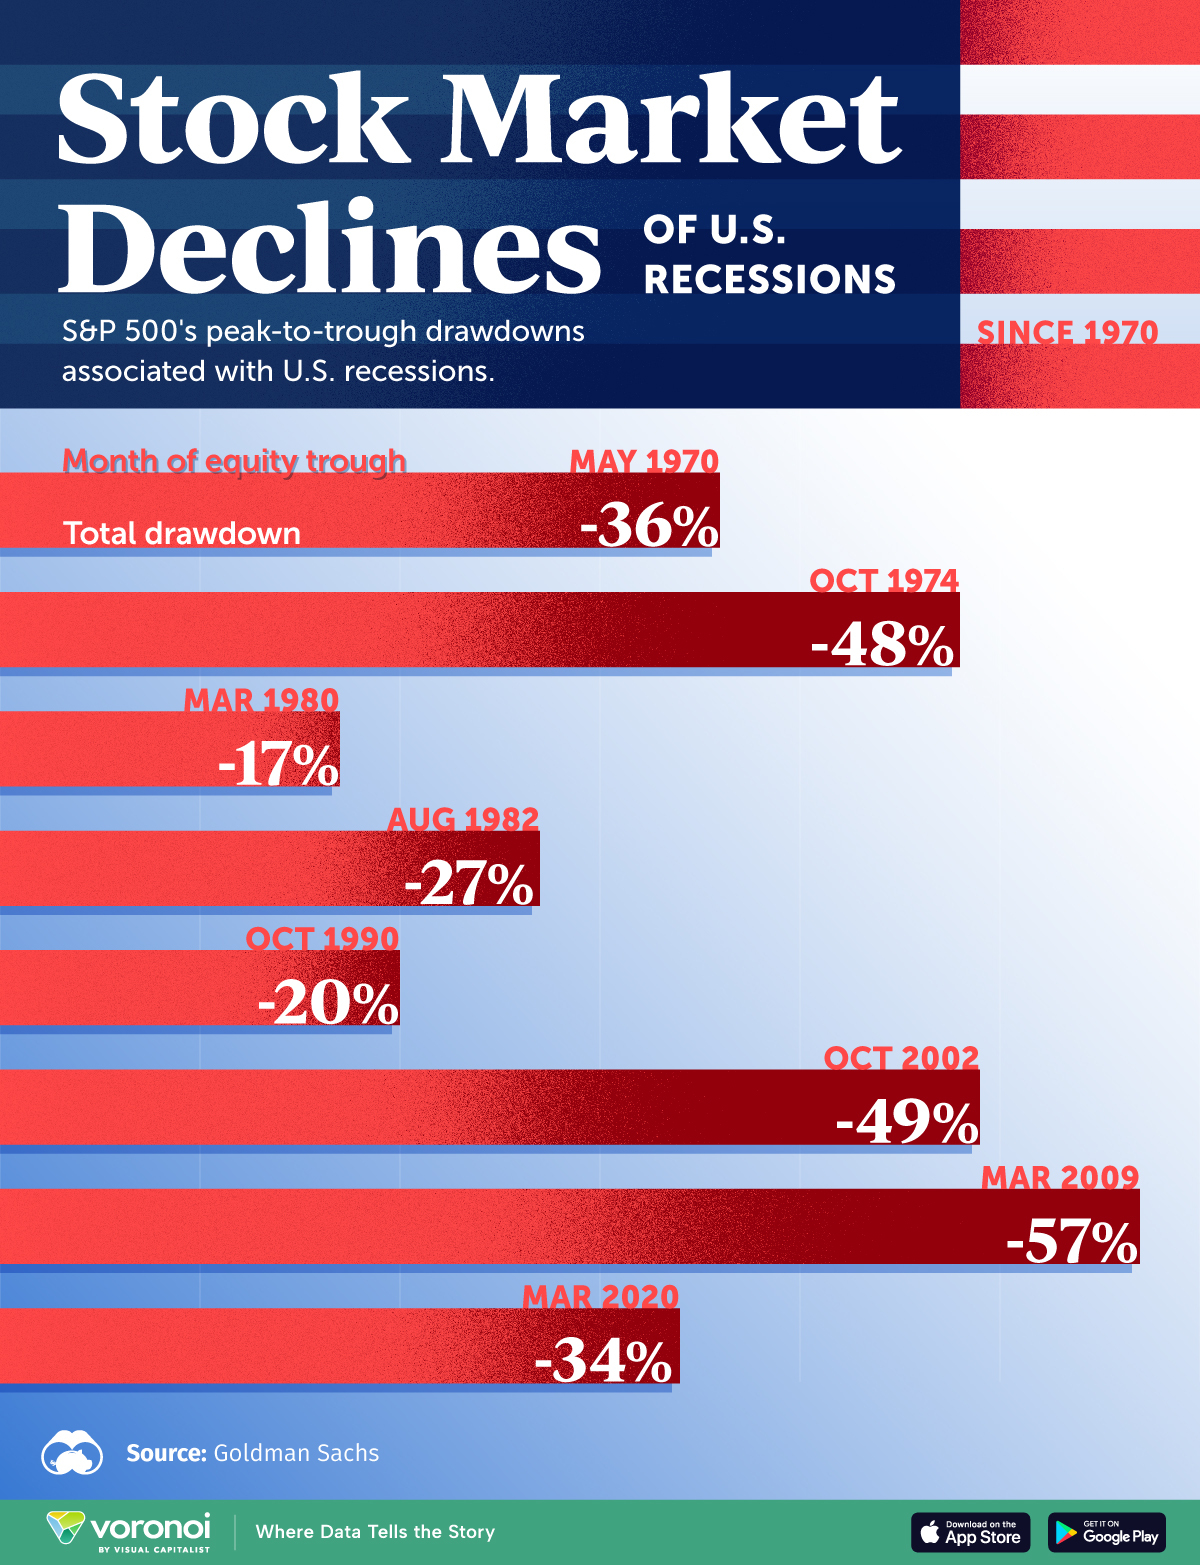
This graphic shows every U.S. recession’s peak-to-trough decline in the S&P 500 since 1970, using data from Goldman Sachs.
The Largest Stock Market Crashes in the U.S. Since 1970
Below, we show the S&P 500’s greatest peak-to-trough declines associated with recessions over the last five decades:
| Month of S&P 500 Low During U.S. Recession | Total Peak-to-Trough Drawdown of Recession |
|---|---|
| Mar 2020 | -34% |
| Mar 2009 | -57% |
| Oct 2002 | -49% |
| Oct 1990 | -20% |
| Aug 1982 | -27% |
| Mar 1980 | -17% |
| Oct 1974 | -48% |
| May 1970 | -36% |
The biggest decline in the U.S. stock market came during the global financial crisis which saw the S&P 500 lose over half of its value, while the stock prices of Citigroup and AIG plummeted more than 90% due to their exposure to subprime loans.
In the years leading up to the crash, the U.S. housing market grew overleveraged as the subprime mortgage market, which originated in 1999, expanded rapidly. By 2008, borrowers with low credit ratings began defaulting on their loans, resulting in 3.1 million foreclosures that year.
The bursting of the dot-com bubble marked the second-largest market crash, with the S&P 500 dropping 49% from its peak. When the Federal Reserve began raising interest rates between 1999 and 2000, overvalued internet stocks were among the hardest hit. At the time, companies like Amazon, Yahoo, and Qualcomm saw their stock prices plunge by over 80%. While many dot-com companies failed, some, like Amazon, achieved remarkable growth in the following decades.
During the recessions of 1980 and 1981-1982, the Federal Reserve under Chairman Paul Volcker implemented aggressive monetary policies to combat soaring inflation, significantly raising the federal funds rate to a peak of over 19% in 1981.
While this tightening contributed to economic contractions and heightened market volatility, the stock market drawdowns in these two recessions were on the lower end. The 1980s ultimately became one of the best-performing decades for the S&P 500, with the market rising by a total 232% during that decade.
As the economy in 2024 faces a looming recession amidst the triggering of the Sahm Rule, investors can look to historical parallels for a guide on how the stock market may react.
Learn More on the Voronoi App
To learn more about this topic from a historical bull and bear market perspective, check out this graphic on 60 years of stock market cycles.
The post Charted: The Biggest U.S. Stock Market Crashes Since 1970 appeared first on Visual Capitalist.