![]()
See this visualization first on the Voronoi app.

Use This Visualization
Chart: The Foreign-Born Share of the U.S. Population (1850-2024)
This was originally posted on our Voronoi app. Download the app for free on iOS or Android and discover incredible data-driven charts from a variety of trusted sources.
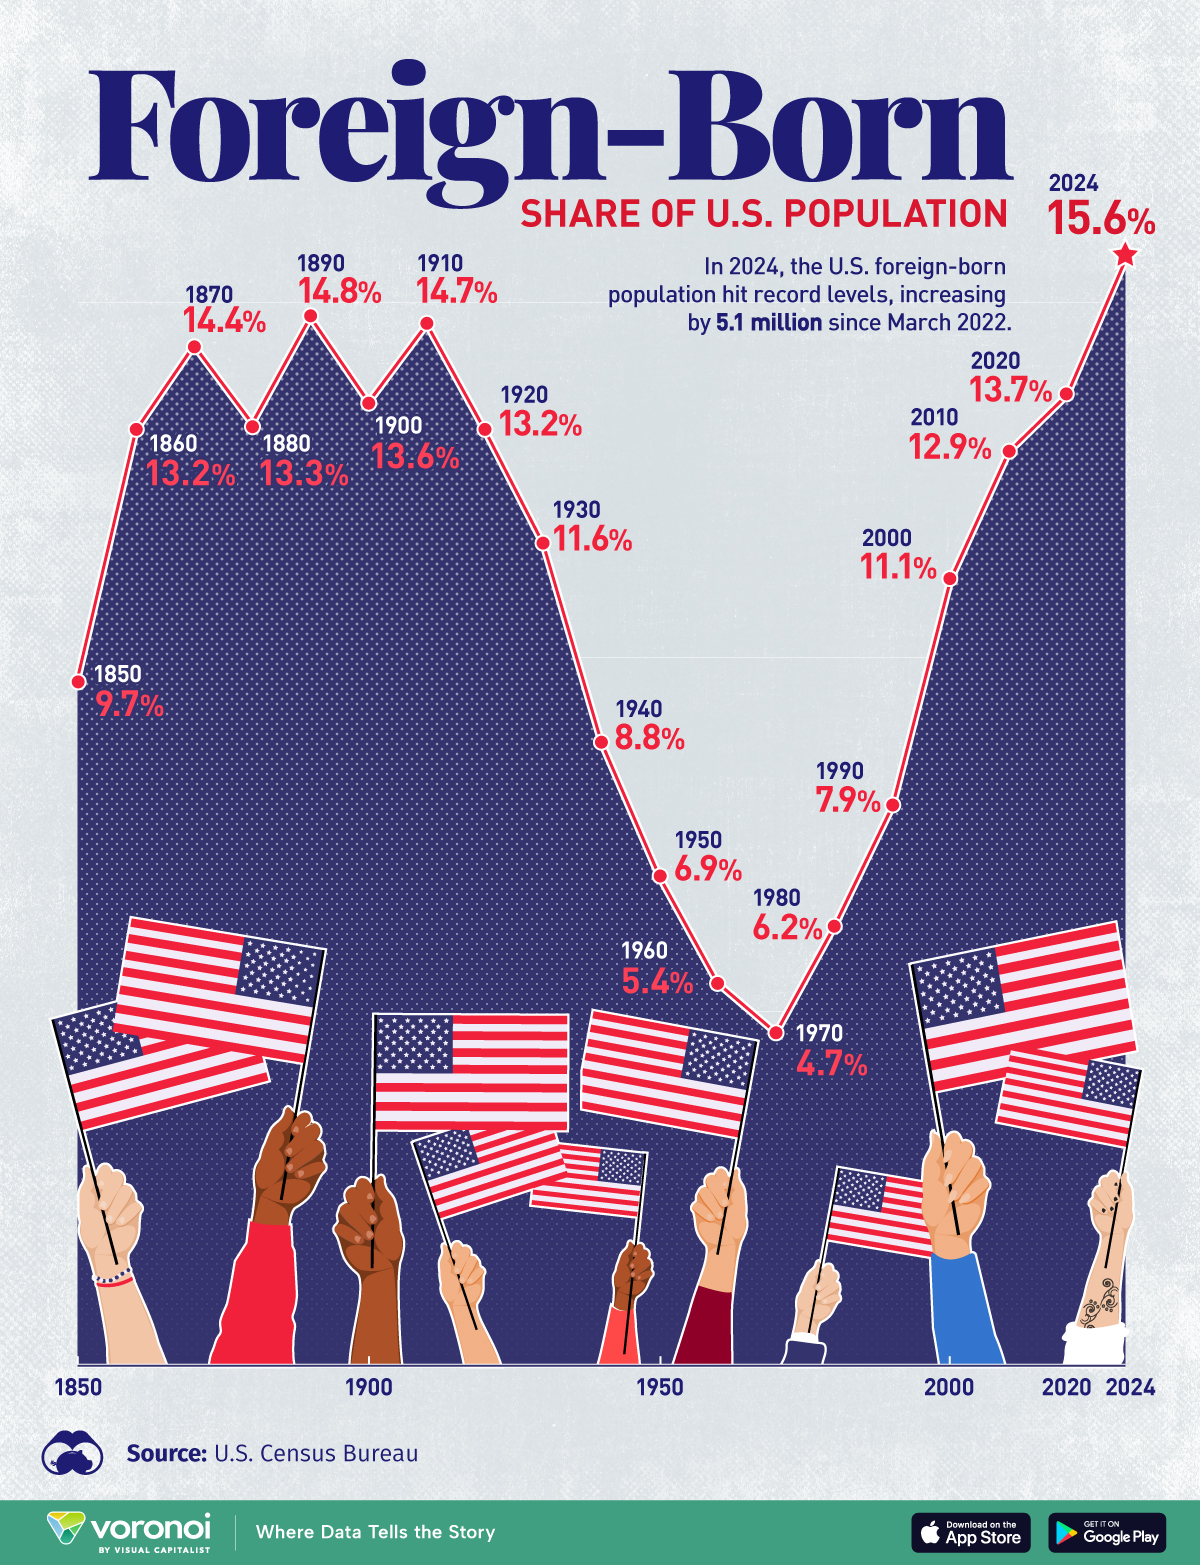
The U.S. foreign-born population has surged to 15.6%, the highest in the nation’s history, as people seek refuge from war, organized violence, and political repression.
The last time immigration reached comparable levels was in 1890, when 14.8% of the population consisted of immigrants. During this great wave, migrants sought to escape agricultural failures and limited job prospects, attracted by the economic opportunities the U.S. offered.
This graphic shows the foreign-born share of the U.S. population over time, based on data from the U.S. Census Bureau via The Center for Immigration Studies.
U.S. Migrant Population Hits Record High
Over the past two years, the U.S. foreign-born population has grown at a record pace, reaching 51.6 million by March 2024.
Immigration has steadily risen over the last 50 years, fueled by labor market gaps, an aging population, and prolonged legislative gridlock, despite repeated efforts by Congress to pass comprehensive immigration reform.
| Year | Foreign-Born Share of U.S. Population | Number |
|---|---|---|
| 2024 | 15.6% | 51.6M |
| 2020 | 13.7% | 45.1M |
| 2010 | 12.9% | 40.0M |
| 2000 | 11.1% | 31.1M |
| 1990 | 7.9% | 19.8M |
| 1980 | 6.2% | 14.1M |
| 1970 | 4.7% | 9.6M |
| 1960 | 5.4% | 9.7M |
| 1950 | 6.9% | 10.3M |
| 1940 | 8.8% | 11.6M |
| 1930 | 11.6% | 14.2M |
| 1920 | 13.2% | 13.9M |
| 1910 | 14.7% | 13.5M |
| 1900 | 13.6% | 10.3M |
| 1890 | 14.8% | 9.2M |
| 1880 | 13.3% | 6.7M |
| 1870 | 14.4% | 5.6M |
| 1860 | 13.2% | 4.1M |
| 1850 | 9.7% | 2.2M |
Data as of March 2024.
As the above table shows, the foreign-born share of the U.S. population hit a low of 4.7% in 1970 but has since tripled.
This increase was significantly influenced by the 1965 Immigration and Nationality Act, which prioritized family reunification, skilled labor, and a more diverse pool of applicants. While the share of lawful permanent residents has remained relatively steady over the past decade, undocumented migrants have seen the biggest increase overall.
Today, America’s strong labor market continues to attract immigrants, with wages as much as 10 times higher than those in many Latin American countries—the primary source of new arrivals. Since 2020, 6.5% of immigrants have found work in construction, 4.2% as maids or housekeepers, and 3.8% as cooks. Interestingly, software developers are the eighth most common occupation among recent immigrants, accounting for 2.5% of immigrant workers.
Economic hardship also plays a key role. In Venezuela, for instance, hyperinflation is forcing millions to undertake the dangerous journey through Mexico to America. In response, both the U.S. and Mexico have begun flying migrants back to their countries of origin, though Venezuelan President Nicolás Maduro blocked these flights earlier this year in retaliation to U.S. sanctions.
Given these challenges, immigration remains a complex and contentious issue. The U.S., like many other advanced economies, faces an underfunded immigration system influenced by both domestic politics and geopolitical factors.
Learn More on the Voronoi App
To learn more about this topic from a political perspective, check out this graphic on net immigration by U.S. president.
The post Charted: The Foreign-Born Share of the U.S. Population (1850-2024) appeared first on Visual Capitalist.