![]()
See this visualization first on the Voronoi app.
Use This Visualization
Ranked: S&P 500 Returns in First 100 Days of Presidency
This was originally posted on our Voronoi app. Download the app for free on iOS or Android and discover incredible data-driven charts from a variety of trusted sources.
Markets often react quickly, and sometimes dramatically, to the start of new presidential terms, as investors anticipate how changes in leadership and policy will impact the economy, corporate growth, and regulatory environments.
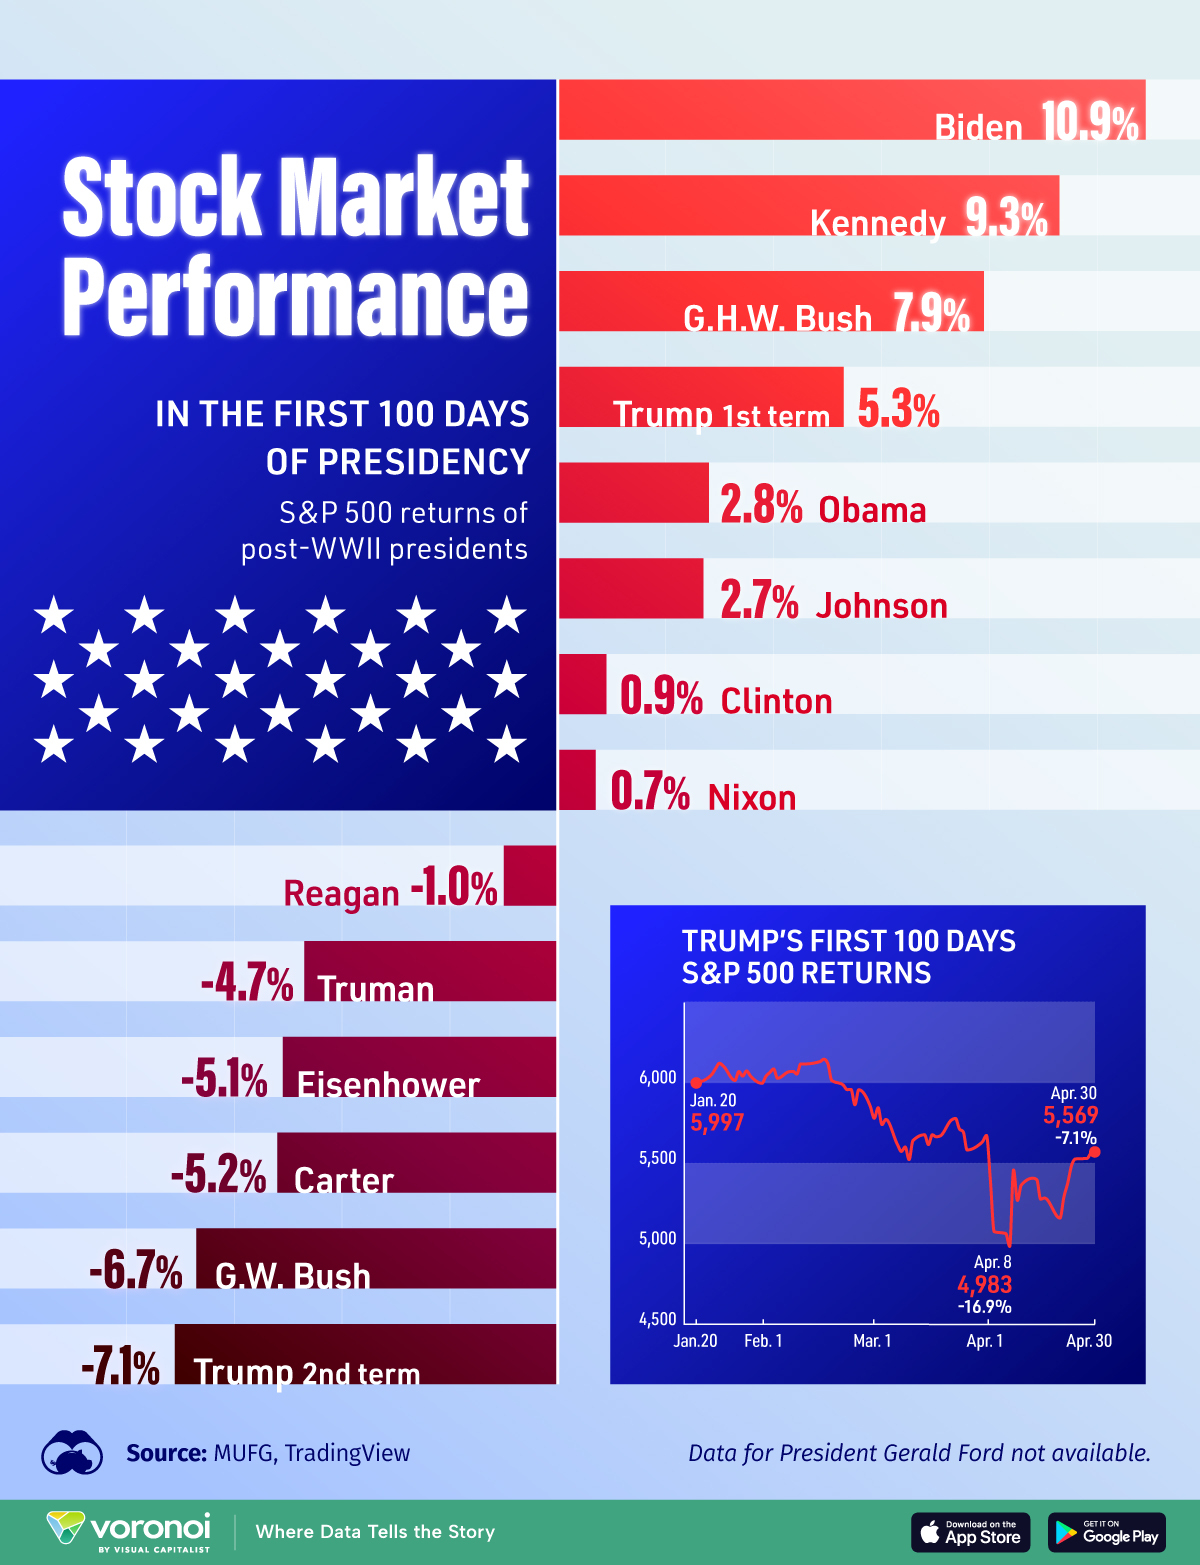
This graphic visualizes the S&P 500 returns during post-WWII presidents’ first 100 days.
Data comes from TradingView and Bloomberg via MUFG, and is updated as of April 30, 2025.
Values are shown for first 100 days after elected term. Both of Trump’s terms are visualized, while all other presidents’ first terms are visualized except Truman and Johnson, which are their second terms.
Presidents Ford’s data was not available from the source.
Market Slump in Trump’s Early Days
Below, we show the S&P 500 returns of each post-WWII presidents’ first 100 days.
| President | Year of Inauguration | First 100 Days S&P 500 Returns |
|---|---|---|
| Biden | 2021 | 10.9% |
| Kennedy | 1961 | 9.3% |
| H.W. Bush | 1989 | 7.9% |
| Trump (first term) | 2017 | 5.3% |
| Obama | 2009 | 2.8% |
| Johnson | 1965 | 2.7% |
| Clinton | 1993 | 0.9% |
| Nixon | 1969 | 0.7% |
| Regan | 1981 | -1.0% |
| Truman | 1949 | -4.7% |
| Eisenhower | 1953 | -5.1% |
| Carter | 1977 | -5.2% |
| G.W. Bush | 2001 | -6.7% |
| Trump (second term) | 2025 | -7.1% |
The stock market had its worst start in modern history during President Donald Trump’s first 100 days of his second term, with the S&P 500 falling by 7.1%
This was the steepest decline for the index in the first 100 days of any presidency since Nixon’s second term.
During the four trading days leading up to April 8, the S&P 500 suffered its largest four-day loss since the index’s creation, following Trump’s “Liberation Day” global tariff announcement.
At its lowest point on April 8, the S&P 500 was down by as much as 16.9% from its level at inauguration.
Below, we show the S&P 500’s performance in Trump’s first 100 days.
| Date | S&P 500 | Percentage |
|---|---|---|
| 2025-01-17 | 5996.65 | |
| 2025-01-21 | 6049.23 | 0.88% |
| 2025-01-22 | 6086.36 | 1.50% |
| 2025-01-23 | 6118.72 | 2.04% |
| 2025-01-24 | 6101.25 | 1.74% |
| 2025-01-27 | 6012.29 | 0.26% |
| 2025-01-28 | 6067.71 | 1.18% |
| 2025-01-29 | 6039.32 | 0.71% |
| 2025-01-30 | 6071.18 | 1.24% |
| 2025-01-31 | 6040.52 | 0.73% |
| 2025-02-03 | 5994.58 | -0.03% |
| 2025-02-04 | 6037.89 | 0.69% |
| 2025-02-05 | 6061.47 | 1.08% |
| 2025-02-06 | 6083.56 | 1.45% |
| 2025-02-07 | 6025.98 | 0.49% |
| 2025-02-10 | 6066.45 | 1.16% |
| 2025-02-11 | 6068.49 | 1.20% |
| 2025-02-12 | 6051.98 | 0.92% |
| 2025-02-13 | 6115.08 | 1.97% |
| 2025-02-14 | 6114.62 | 1.97% |
| 2025-02-18 | 6129.57 | 2.22% |
| 2025-02-19 | 6144.14 | 2.46% |
| 2025-02-20 | 6117.51 | 2.02% |
| 2025-02-21 | 6013.12 | 0.27% |
| 2025-02-24 | 5983.26 | -0.22% |
| 2025-02-25 | 5955.26 | -0.69% |
| 2025-02-26 | 5956.07 | -0.68% |
| 2025-02-27 | 5861.56 | -2.25% |
| 2025-02-28 | 5954.51 | -0.70% |
| 2025-03-03 | 5849.71 | -2.45% |
| 2025-03-04 | 5778.14 | -3.64% |
| 2025-03-05 | 5842.62 | -2.57% |
| 2025-03-06 | 5738.53 | -4.30% |
| 2025-03-07 | 5770.19 | -3.78% |
| 2025-03-10 | 5614.55 | -6.37% |
| 2025-03-11 | 5572.08 | -7.08% |
| 2025-03-12 | 5599.29 | -6.63% |
| 2025-03-13 | 5521.53 | -7.92% |
| 2025-03-14 | 5638.93 | -5.97% |
| 2025-03-17 | 5675.11 | -5.36% |
| 2025-03-18 | 5614.65 | -6.37% |
| 2025-03-19 | 5675.3 | -5.36% |
| 2025-03-20 | 5662.88 | -5.57% |
| 2025-03-21 | 5667.57 | -5.49% |
| 2025-03-24 | 5767.56 | -3.82% |
| 2025-03-25 | 5776.66 | -3.67% |
| 2025-03-26 | 5712.21 | -4.74% |
| 2025-03-27 | 5693.32 | -5.06% |
| 2025-03-28 | 5580.95 | -6.93% |
| 2025-03-31 | 5611.84 | -6.42% |
| 2025-04-01 | 5633.06 | -6.06% |
| 2025-04-02 | 5670.98 | -5.43% |
| 2025-04-03 | 5396.51 | -10.01% |
| 2025-04-04 | 5074.09 | -15.38% |
| 2025-04-07 | 5062.24 | -15.58% |
| 2025-04-08 | 4982.78 | -16.91% |
| 2025-04-09 | 5456.89 | -9.00% |
| 2025-04-10 | 5268.06 | -12.15% |
| 2025-04-11 | 5363.35 | -10.56% |
| 2025-04-14 | 5405.96 | -9.85% |
| 2025-04-15 | 5396.62 | -10.01% |
| 2025-04-16 | 5275.71 | -12.02% |
| 2025-04-17 | 5282.69 | -11.91% |
| 2025-04-21 | 5158.19 | -13.98% |
| 2025-04-22 | 5287.77 | -11.82% |
| 2025-04-23 | 5375.85 | -10.35% |
| 2025-04-24 | 5484.78 | -8.54% |
| 2025-04-25 | 5525.22 | -7.86% |
| 2025-04-28 | 5528.74 | -7.80% |
| 2025-04-29 | 5560.82 | -7.27% |
| 2025-04-30 | 5569.07 | -7.13% |
The S&P 500 has been on a roller coaster since Trump’s inauguration, plunging from an all-time high into bear market territory within just a month and a half as markets reacted sharply to a series of tariff announcements and subsequent rollbacks.
This market volatility has coincided with a notable slowdown in the broader U.S. economy.
America’s 2025 first quarter real GDP is projected to decline by 0.3%, the first contraction since early 2022.
Learn More on the Voronoi App ![]()
To learn more about Trump’s impact in his first 100 days, check out this graphic that visualizes the breakdown of Trump’s 143 executive orders in his first few months in office.