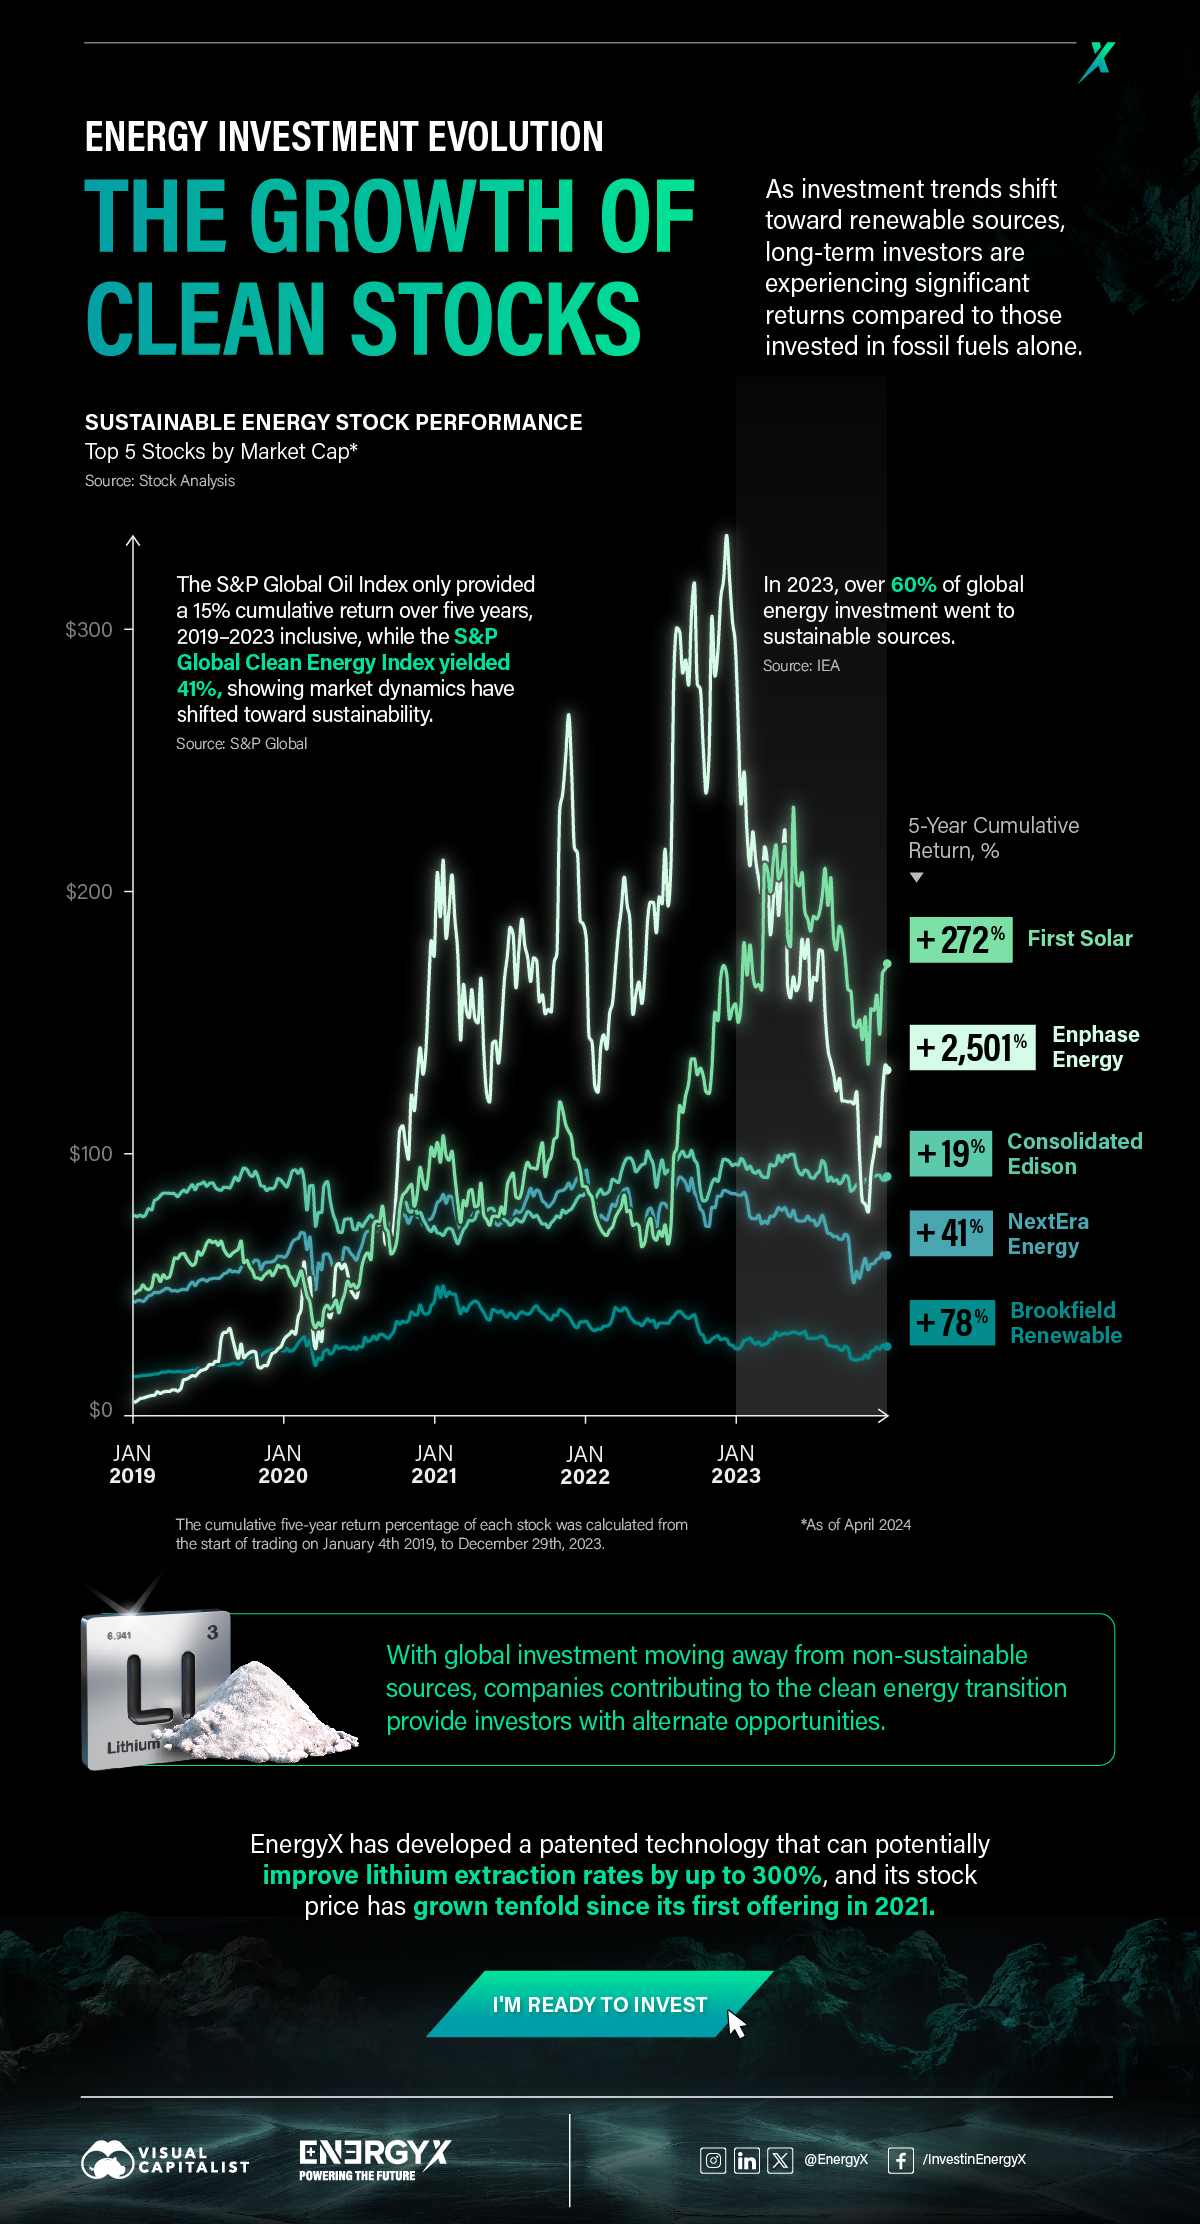
Visualized: The Growth of Clean Energy Stocks

Published
9 seconds ago
on
May 28, 2024
| 8 views
-->
By
Alan Kennedy
Article & Editing
- Julia Wendling
Graphics & Design

Published
9 seconds ago
on
May 28, 2024
| 8 views
-->
By
Alan Kennedy
Article & Editing
Graphics & Design
![]()
See this visualization first on the Voronoi app.

The Carbon Footprint of Major Travel Methods
This was originally posted on our Voronoi app. Download the app for free on iOS or Android and discover incredible data-driven charts from a variety of trusted sources.

By Brandon Smith

How to use: Arrows on side navigate between each type of energy.
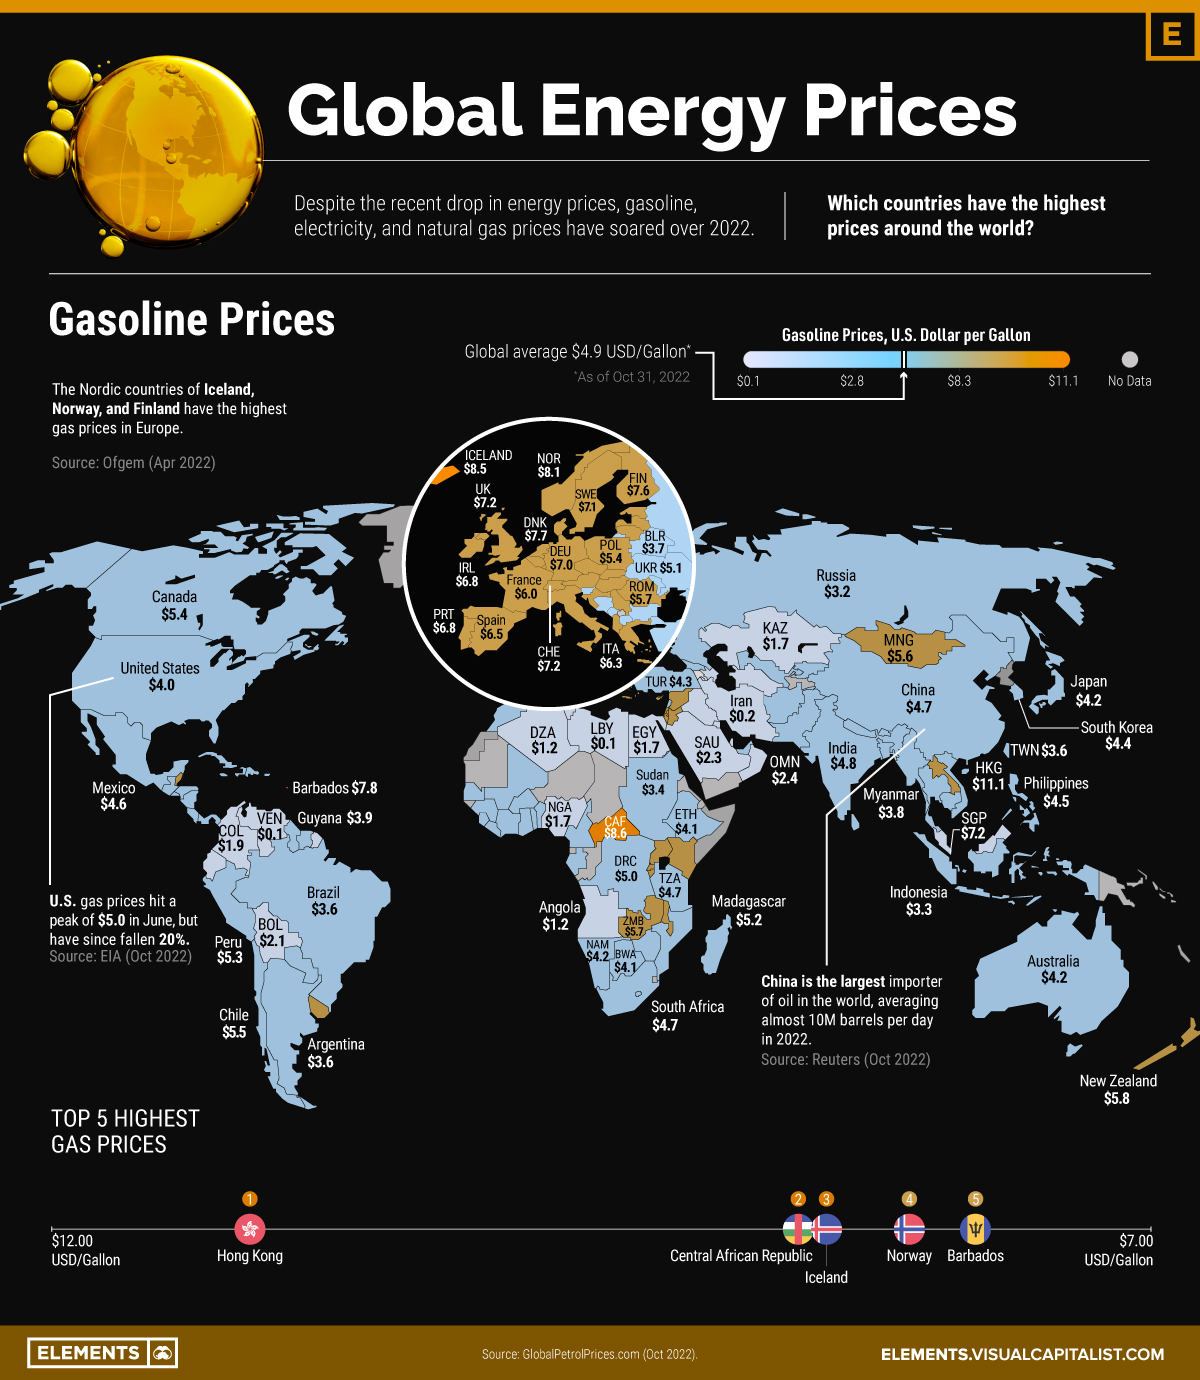
Mapped: Global Energy Prices, by Country in 2022
This was originally posted on Elements. Sign up to the free mailing list to get beautiful visualizations on natural resource megatrends in your email every week.
For some countries, energy prices hit historic levels in 2022.

Click to view a larger version of the graphic.
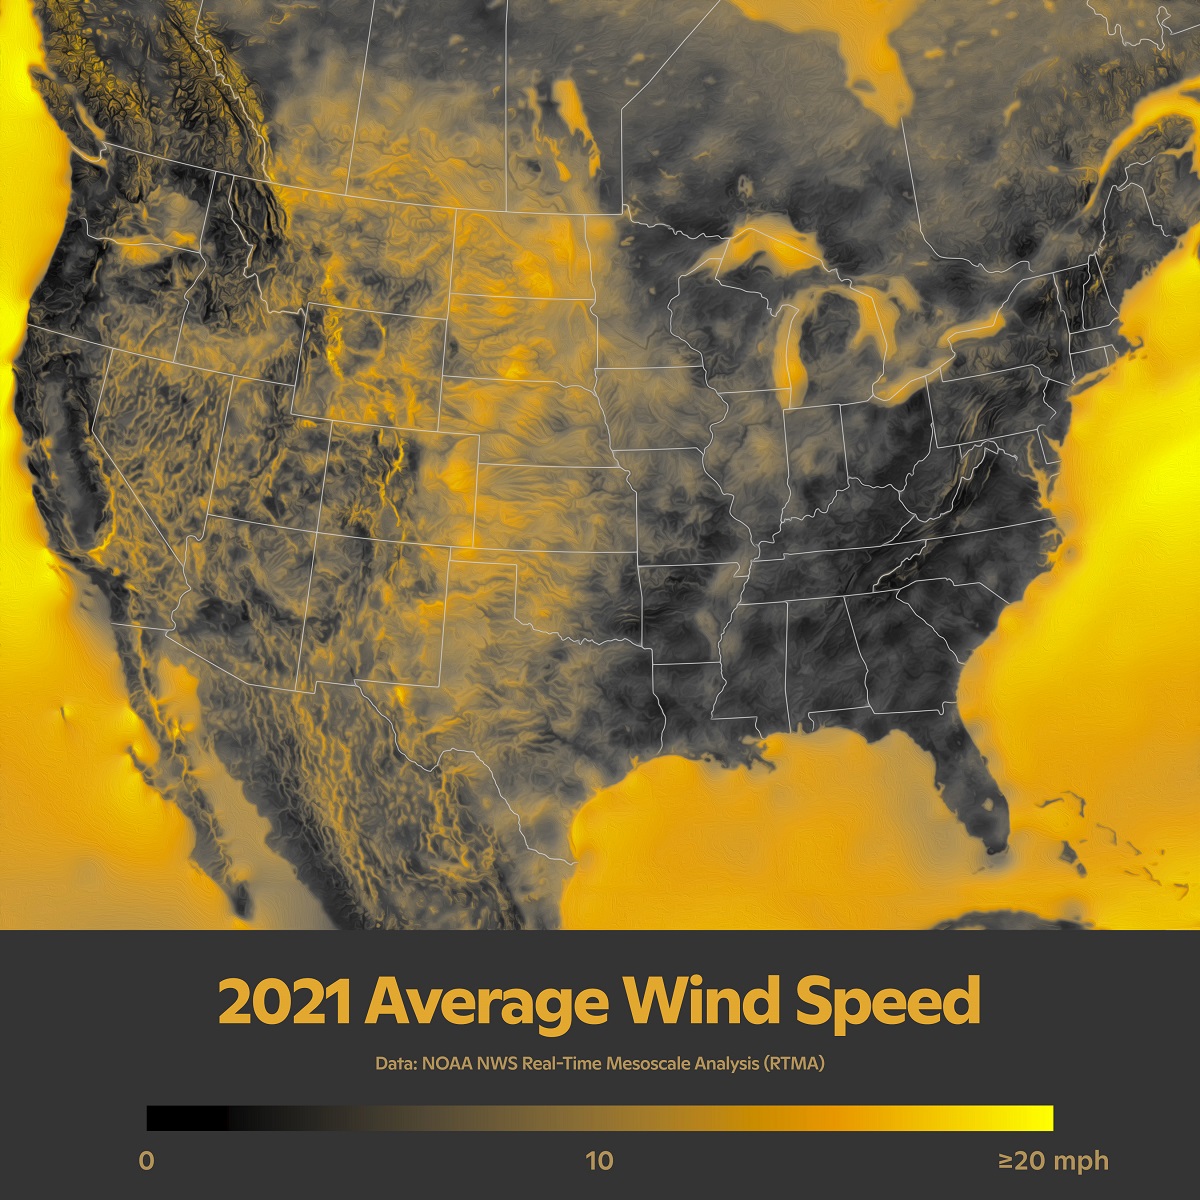
Mapped: Average Wind Speed Across the U.S.
Wind energy is a hot topic in North America and around the world as a decarbonization tool, but full utilization requires a lot of wind.
This graphic from the team at the Woodwell Climate Research Center maps the average wind speed of the continental U.S. based on NOAA data from 2021.