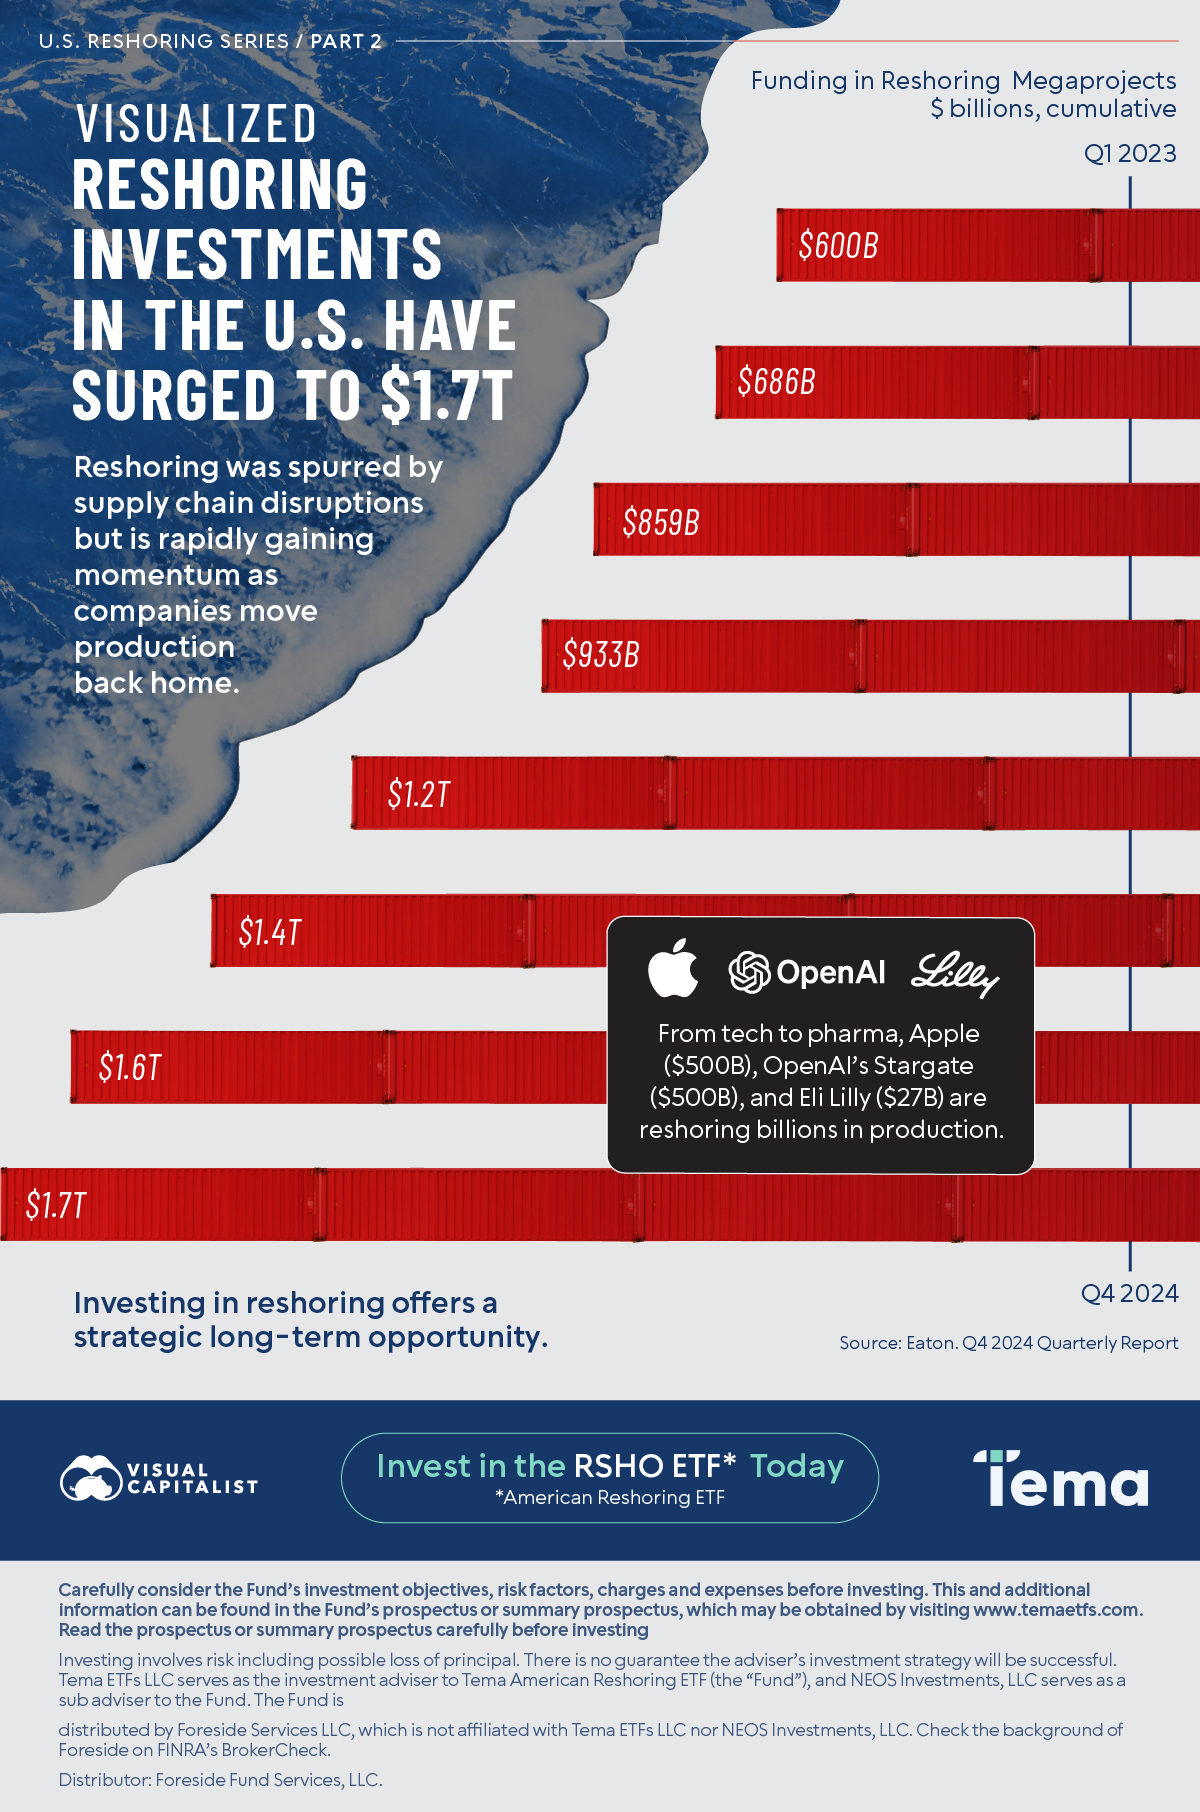
Visualized: Reshoring Investments in the U.S. Have Surged to $1.7T
Published
2 hours ago
on
June 13, 2025
| 19 views
-->
By
Julia Wendling
Graphics & Design
Published
2 hours ago
on
June 13, 2025
| 19 views
-->
By
Julia Wendling
Graphics & Design
Published
1 hour ago
on
May 30, 2025
| 14 views
-->
By
Julia Wendling
Article & Editing
Graphics & Design
Published
56 mins ago
on
May 22, 2025
| 86 views
-->
By
Julia Wendling
Graphics & Design
Published
24 mins ago
on
May 16, 2025
| 44 views
-->
By
Julia Wendling
Graphics & Design
![]()
See this visualization first on the Voronoi app.
Use This Visualization
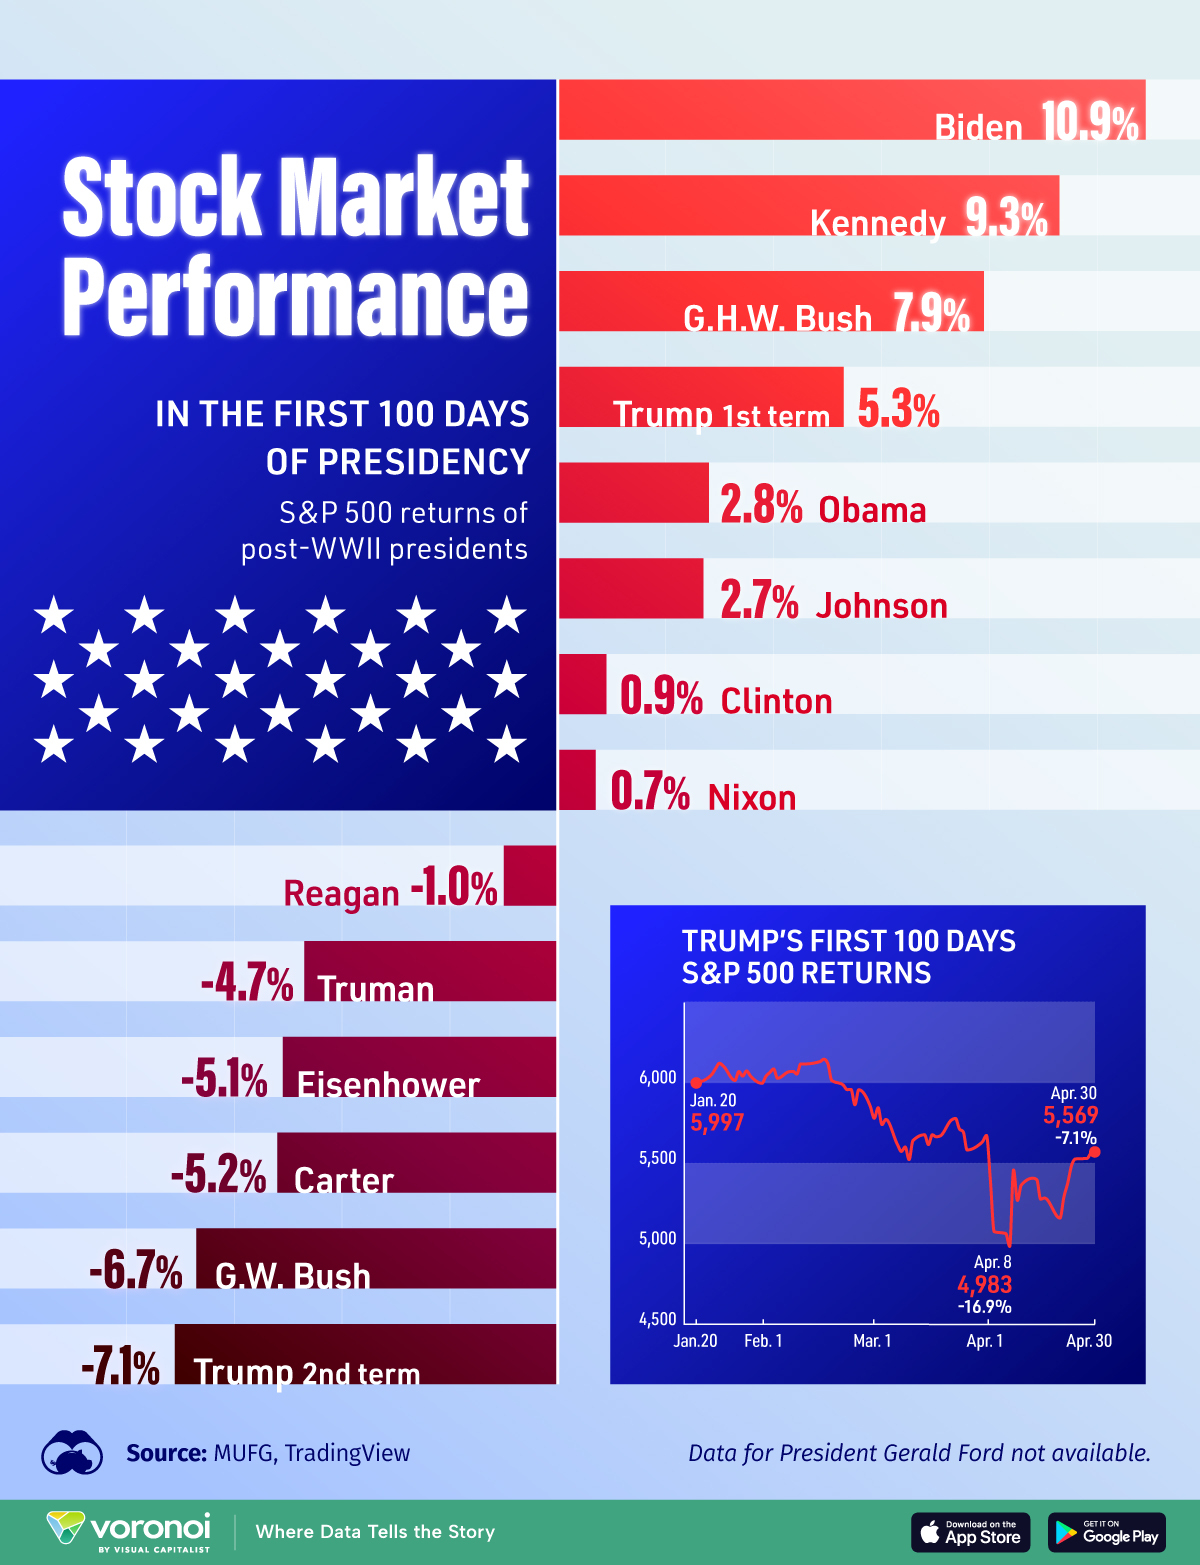
Ranked: S&P 500 Returns in First 100 Days of Presidency
This was originally posted on our Voronoi app. Download the app for free on iOS or Android and discover incredible data-driven charts from a variety of trusted sources.