By Wolf Richter, WOLF STREET
Companies are still borrowing and spending billions on buying back their own shares – one of the big drivers behind the blistering stock market rally of the past few years. It worked wonderfully and without fail. But suddenly, it’s doing the opposite, and now the shares of the biggest buyback queens are getting hammered. Something broke in the gears of this financially engineered market!
During the November-January period, 378 of the S&P 500 companies bought back their own shares, according to FactSet. Total buybacks in the quarter rose 5.2% from a year ago, to $136.6 billion. Over the trailing 12 months (TTM), buybacks totaled $568.9 billion.
That’s an enormous amount of corporate cash that was dumped on the market!
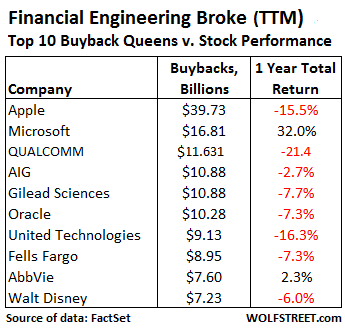
The sector that blew – “blew” because that’s how it turned out – the most money on this type of financial engineering project was Information Technology, with $33.2 billion in buybacks last quarter. Four of the top 10 buyback queens were Information Technology: Apple, Microsoft, Oracle, and Visa.
Apple alone blew $6 billion in the quarter, even as its stock was tanking. Relative to its average share price over the period, it paid a 13% premium, the second highest premium paid by S&P 500 companies, after Symantec! Over the trailing 12 months, Apple blew nearly $40 billion on buybacks, and yet its stock dropped 15.5%.
This table shows the top 10 buyback queens in order of the amount spent on a TTM basis, and the mostly dismal performance of their shares over the same period.
GE didn’t quite make this list (though it bought back $3.1 billion in Q4), but it was very active in different ways, following through on its $50-billion buyback program announced in April last year. FactSet:
In addition to the repurchase program, GE completed a stock swap with the former GE Capital retail finance division, Synchrony Financial, which had an effect on shares outstanding that was equivalent to a $20.4 billion buyback. As a result, the shares outstanding for GE were reduced by 6.7% in the last twelve months.
Total buybacks are ballooning in proportion to net income, which declined over the TTM period for the first time since 2009. So buybacks as a percent of income rose from 64.9% a year ago to 68.1% at the end of the quarter. In terms of free cash flow after dividends, share buybacks have now ballooned to 101.7%. This was, as FactSet put it, “a huge jump from the year ago quarter when the ratio was 81.6%.”
The culprit? With income down over the TTM period, aggregate free cash flow has dropped 9.5% year-over-year.
FactSet’s chart shows the declining net income (green bars), the nearly flat share-buybacks (blue bars), and the rising buyback-to-income ratio (red line, right scale). Note what happened last time income began to decline (2007) and share buybacks followed in 2008: the stock market crashed.
[image]https://wolfstreet.com/wp-content/uploads/2016/03/US-Buybacks-to-net-income-2016-03-ttm.png[/image]
And yet, despite the current heroic efforts to prop up their shares, companies have seen their shares get hammered.
As FactSet’s chart below shows, over the past 12 months, the S&P 500 total return index, which included dividends, rose 1.3% (green line). But the total return of SPDR S&P 500 Buyback ETF, which tracks the 100 companies in the S&P 500 with the highest buyback ratio, dropped 7.6% (blue line):
[image]https://wolfstreet.com/wp-content/uploads/2016/03/US-buyback-v-sp500-stock-performance-2015-03-ttm.png[/image]
Clearly, financial engineering is kaput! Buybacks no longer function reliably in inflating stock prices. The opposite seems to be happening. Perhaps investors are finally starting to see through these shenanigans, and perhaps they’re now beginning to fret about all the debt these companies take on in order to fund buybacks!
When companies borrow billions to then blow that moolah on buying their own shares that then promptly decline in value, it doesn’t create a loss on the income statement. Instead, those billions quietly go up in smoke. What’s left behind? Fewer shares outstanding, piles of additional debt, mauled cash balances, and much higher financial risk.
But once companies see that share buybacks are becoming toxic as their shares decline despite buybacks, they curtail them. And last time this happened – in 2008 – it pulled the rug out from under the already teetering markets.
The bull market from early 2009 into May 2015 looks just like every bubble in history, and there’s one sign after the next that we did indeed peak last May. The dominant pattern in the stock market is the “rounded top” pattern. Read… This Chart Shows the First Big Crash Is Likely Just Ahead