Submitted by Lance Roberts via RealInvestmentAdvice.com,
Is The Bull Market Back, Or Is It A Trap?
I wish I had a more definitive answer for you this week, but the market is standing at the proverbial “crossroads” of bull and bear.
From a “fundamental” perspective there is not much good news. The past week we saw numerous companies beating extremely beaten down estimates. However, while JPM and C got a boost to their stock price, the actual earnings, revenue and profits trends were clearly negative.
But that is the new normal. We live in an environment where Central Banking has taken control of financial markets by leaving investors “no option” for a return on cash. Therefore, the “hope” remains that asset prices can remain detached from underlying fundamentals long enough for them to catch up.
As I noted last week:
“However, not surprisingly, shortly after I published the article I received numerous emails citing low interest rates, accounting rule changes, and debt-funded buybacks all as reasons why “this time is different.” While such could possibly be true, it is worth noting that each of these supports are both artificial and finite in nature.
Currently, the aging U.S. economy, where productivity has exploded, wage growth has remained weak and whose households are weighed down by surging debt, remains mired in a slow-growth funk. This slow-growth funk has, in turn, put a powerful shareholder base to work increasing pressure on corporate managers not to invest, and to recycle capital into dividends and buybacks instead which has led to a record level of corporate debt.
These actions, as suggested above, are limited in nature. For a while, these devices kept ROE elevated, however, the efficacy of those actions have now been reached.”
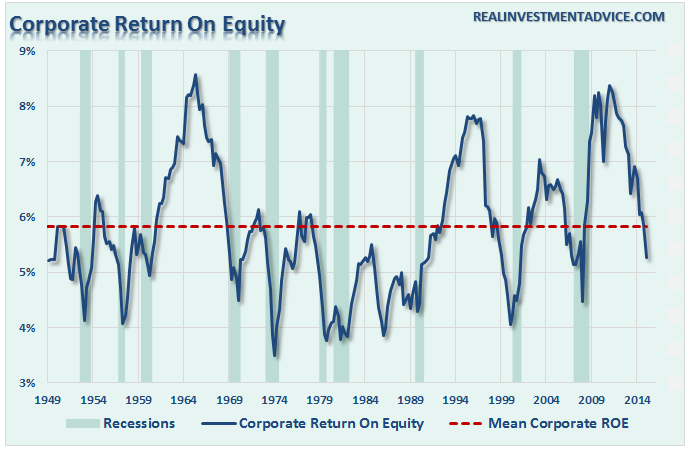
“Importantly, profit margins and ROE are reasonably well-correlated which is what creates the perception that profit margins mean-revert. However, ROE is a better indicator of what is happening inside of corporate balance sheets more so than just profit margins. The current collapse in ROE is likely sending a much darker message about corporate health than profit margins currently. “
But despite collapsing profit margins, ROE, and surging corporate debt levels, asset prices remain near all-time highs. The chart below shows corporate profits after tax and eps as compared to asset prices. Historically, the detachment between fundamentals and prices has not lasted indefinitely and are almost always corrected either through a bear market, recession or both.
[image]https://realinvestmentadvice.com/wp-content/uploads/2016/04/Corporate-Profits-Earnings-PerShare-Deviation-041416.png[/image]
But is this time different?
Have global Central Banks actually figured out how to repeal economic cycles and keep investors permanently aligned to the markets? The following charts would appear to suggest such is indeed the case.
The cumulative advance-decline line is breaking out to new-highs after 355 days of correction. Historically, such declines in the A/D line have been more coincident with much more severe market corrections. As noted by Dana Lyons:
“The NYSE A-D Line has negatively diverged at every cyclical top in the S&P 500 in the last 50 years (by the way, that day, May 21, marked the precise all-time high close in the S&P 500 to date…golf clap).”
[image]https://realinvestmentadvice.com/wp-content/uploads/2016/04/tumblr_inline_o5n04tEv4G1sq14jh_500.jpg[/image]
“Now does this mean the market has to top every time there is a divergence? No. Furthermore, the A-D Line can, and has, diverged for prolonged periods before any ill effects are felt in the stock market. Still, given the plethora of concerns we had regarding a possible cyclical top at the time, and given the fact that this mere 1-month divergence was the first real divergence during the course of the 6-year bull market, this was a development that demanded recognition. It was an important piece of the “topping” puzzle that had been missing, and was now in place.
So what now? Does the new high in the A-D Line mean the bull market is back on track – or never left? We say yes…and no. Let’s start with no. Our best guess still, based on all the evidence at hand, is that the broad stock market formed (or is still forming) a cyclical top over the past 12 months. We realize that may be a difficult proposition to grasp for market observers who only watch the price of the S&P 500.
Why do we say “yes”, the bull may be back on track? Strictly based on the historical relationship of the NYSE A-D Line and S&P 500 around cyclical tops, the evidence would suggest that the S&P 500 has not yet made its final high for the cycle. Remember that the A-D Line has topped before the index at every cyclical top in the last 50 years, without exception. The fact that the NYSE A-D Line hit a new high yesterday tells us that A) the A-D Line has not yet diverged and, therefore, B) the S&P 500 has not yet topped.”
The whole piece is worth reading. However, the breakout of the A/D line is not the only piece of evidence that suggests the bull market isn’t quite dead as of yet.
Investor sentiment (both individual and professional) is currently at levels that are more normally associated with bigger corrections in the market.
[image]https://realinvestmentadvice.com/wp-content/uploads/2016/04/AAII-IINV-Bearish-Sentiment-041416-1.png[/image]
As noted, the 13-week moving average of bearish sentiment has reached levels currently that are more normally associated with bottoms to corrective processes as seen in 2010 and 2011 when the Federal Reserve intervened with QE2 and Operation Twist.
However, while this surge in bearish sentiment has occurred, which normally denotes a substantial level of fear by investors, there has been no substantial change to actual allocations.
[image]https://realinvestmentadvice.com/wp-content/uploads/2016/04/AAII-Allocation-Survey-041416.png[/image]
While stock allocations have fallen modestly, cash and bond allocations have barely budged. This is a far different story than was seen during previous major and intermediate-term corrections in the market.
This suggests, is that while investors are worried about the markets and their investments, they are too afraid to actually make changes to their portfolio as long as Central Banks continue to bail out the markets.
“Are you afraid of a market crash? Yes. Are you doing anything about it? No.”
Again, it’s back to fundamentals versus expectations. Someone is going to be very wrong.
The “Rothschild 80/20” Rule
First a quick recap. In May of 2015, I recommended dropping equity exposure in portfolios to 50% and then down to 25% in early February. Yes, I have been underweight equities during the recent rally. Therefore, obviously, I have no clue what I am talking about.
While I have been chastised for not “buying the bottom,” the reality is that those that are taunting me didn’t either. The reality is they are just working on “getting back to even.”
However, what is important, is that my clients have rested easy by not suffering the volatility and declines from the peaks of last year.
Here is my point. As a long-term investor, I don’t need to worry about short-term rallies. I only need to worry about the direction of the overall market trends and focus on capturing the positive and avoiding the negative.
As Baron Nathan Rothschild once quipped:
“You can have the top 20% and the bottom 20%, I will take the 80% in the middle.”
This is the basis of my 80/20 investment philosophy and the driver behind the risk management process.
[image]https://realinvestmentadvice.com/wp-content/uploads/2016/04/80-20-Portfolio-Targeting-062213.png[/image]
While I may not beat the market from one year to the next, I will never have to suffer the time loss of required by “getting back to even.” In the long run, I will win.
As shown in the table below, a $100,000 investment in the S&P 500 returns a far lower value than the “Rothschild 80/20 Rule” model. This is even if I include a ridiculous 2% management fee.
[image]https://realinvestmentadvice.com/wp-content/uploads/2016/04/80-20-Return-Table-041516.png[/image]
But here is how it plays out over the long-term.
[image]https://realinvestmentadvice.com/wp-content/uploads/2016/04/80-20-Example.png[/image]
Yes, it’s only a couple of million dollars worth of difference, but the reduced levels of volatility allowed investors to emotionally “stick” to their discipline over time. Furthermore, by minimizing the drawdowns, asset are allowed to truly “compound” over the long-term.
Get it. Got it. Good.
So…Is it Time To Increase Risk?
The short answer is not just yet. However, if the market can muster a rally above the current downtrend resistance next week, there will be push back to old highs.
[image]https://realinvestmentadvice.com/wp-content/uploads/2016/04/SP500-Chart1-041516.png[/image]
The bullish arguments are:
- Earnings estimates are so low, as we saw with JMP and C this past week, that investors are cheering really crappy earnings reports simply because companies are winning the “beat the estimates” game.
- The improvement in oil prices, and decline of the dollar, has taken some of the pressure off of industrials, energy and material stocks which are being pushed higher. The oil/dollar trends, however, will likely reverse this summer – so, be careful.
- There is a very high level of short-interest in the markets. This is not necessarily bullish, but could provide a short-term catalyst for higher prices.
- Share buybacks continue to be a primary support of asset prices currently. However, this support is coming primarily though leverage which has long-term negative consequences.
There is also a possibility this is a giant trap waiting to be sprung on unwitting investors. Let me direct your attention to the bottom part of the chart above which defines many of my concerns.
Notice that during the previous rally in October of last year, the market similarly rallied to the downtrend resistance and issued a short-term buy signal (blue vertical line). The rally subsequently failed and established a lower low.
The current rally, which is built on a substantially weaker fundamental backdrop, is behaving in much the same way by hitting downtrend resistance, remaining in overbought territory (top part of chart) and issuing a similar buy signal.
However, unfortunately, what small bit of “oversold” condition that existed earlier this week, has been evaporated.
As I stated last week, the markets have currently registered a very short-term buy signal which dictates that we must consider increasing equity risk in portfolios. I would be remiss in not paying attention that signal, but such signals can be a “false flag” during a larger market topping process.
The markets must break above the current downtrend line in order to increase allocations in portfolios. I have already positioned model portfolios to increase exposure back to 50% should such an event occur.
[image]https://realinvestmentadvice.com/wp-content/uploads/2016/04/SP500-Chart1-041516-3.png[/image]
However, it is extremely important to remember that whatever increase in equity risk that I may suggest next week, could very well be reversed in short order due to the following reasons:
- We are moving into the seasonally weak time of year.
- Economic data continues to remain weak
- Earnings are only positive by not sucking as bad as estimates
- Volume is weak
- Longer-term technical underpinnings remain bearish.
- It is the summer of a Presidential election year which tends to be weak.
- The 200 & 400-day moving averages are trending down
- The yield curve is flattening
It is worth remembering that markets have a very nasty habit of sucking individuals into them when prices become detached from fundamentals. That is the case currently, and has generally not had a positive outcome.
The chart below illustrates point #5 above. There are still WAY too many negative divergences in underlying indicators to suggest an “all clear” for investors currently. [image]https://realinvestmentadvice.com/wp-content/uploads/2016/04/long-term-market-dynamics.png[/image]
Let me be VERY CLEAR – this is VERY SHORT-TERM analysis. From a TRADING perspective, there is a tradable opportunity being developed. This DOES NOT mean the markets are about to begin the next great secular bull market.
Caution is highly advised if you are the type of person who doesn’t pay close attention to your portfolio, or if you have an inherent disposition to “hoping things will get back to even” if things go wrong.
What you decide to do with this information is entirely up to you. As I stated, I do think there is enough of a bullish case being built to warrant taking some equity risk on a very short-term basis. We will see what happens next week.
However, the longer-term dynamics are clearly bearish. When those negative price dynamics are combined with the fundamental and economic backdrop, the “risk” of having excessive exposure to the markets greatly outweighs the potential “reward. “
Could the markets rocket up to 2100, 2200 or 2300 as some analysts currently expect? It is quite possible given the ongoing interventions by global Central Banks.
The reality, of course, is that while the markets could reward you with 250 points of upside, there is a risk of 450 points of downside just to retest the previous breakout of 2007 highs
Those are odds that Las Vegas would just love to give you.
Please be careful.
Investing is not a competition.
It is a game of long-term survival.
THE MONDAY MORNING CALL
The Monday Morning Call – Analysis For Active Traders
As I stated above, the markets are potentially close to breaking out of current downtrend resistance which would set the markets up for a push to old highs. As I also stated, we are discussing a situation where investment risk is far “outweighed” by the potential for reward.
However, you can’t manage money without taking on some inherent risk of loss, after all, that is the very nature of investing itself.
Last week, the market began a “backing and filling” process which was necessary to work off some of the overbought condition. Unfortunately, stocks rocketed higher this week following to “secret Fed meetings on the markets” that spooked investors back into the markets. Subsequently, the overbought condition has remained overbought.
[image]https://realinvestmentadvice.com/wp-content/uploads/2016/04/SP500-Short-Term-Trading-041516.png[/image]
All of the very short-term signals are currently suggesting more corrective action is likely. However, such corrective action must not violate important longer term support. If such a violation occurs over the next week or so, the opportunity to add “trading positions” to portfolios will be negated.
This note from Horseman Global is very interesting with respect to the current technical signals being sent. (And hence my concern of this being a trap.)
“A lot of this relatively strong performance came through the use of non-consensus trades such as long yen, Japanese Government Bonds and treasuries.This has meant that we have not been forced to cover our short book, and in fact remain record short. Many other funds have been forced to cover short positions, and are now less net short at much higher prices than six or seven weeks ago. The nature of short selling is that shorts reduce in size when working, encouraging us to add more when they have already fallen, and grow in size when rallying encouraging us to cover.
The other reason that I like short squeezes, is that the best time to short is when other investors have suffered so much psychological damage from being short, they have promised themselves to never short again.
However, I can hear you say, how do you know this is just a short squeeze, and not the beginning of something much more substantial? While equities are trying to send a bullish tune:
- The 200-day moving average is now trending down for S&P, Dax and the Nikkei. This is not bullish.
- Furthermore, yield curves in the US, Japan, and Europe have flattened. This is not bullish.
- The Yen is rallying. This is not bullish.
- We have seen substantial covering by the market. This is not bullish.
To my mind, if you want to be short, this looks about as good as it gets.“
BEFORE you readily dismiss Horseman for being “bearish,” you may want to pay attention to their returns.
[image]https://realinvestmentadvice.com/wp-content/uploads/2016/04/horse-3.jpg[/image]