You are here

Business

Do These Three Charts Spell Doom For The Stock Market?
Do These Three Charts Spell Doom For The Stock Market?

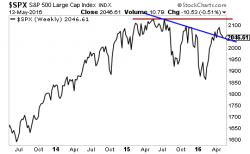
We are now in the worst seasonal period for stocks.

The old adage “sell in May and go away” does have some merit. According to the Ned Davis (NDR) database, had you invested $10,000 in the S&P 500 every May 1st starting in 1950 and sold October 31 of the same year, your initial position would only be worth $10,026 as of 2008. Put another way, by investing only from May through October, a $10,000 stake invested in 1950 would have only made $26 in 57 years.
After An Abysmal First Quarter, Second Quarter Earnings Expectations Are Already Tumbling

After An Abysmal First Quarter, Second Quarter Earnings Expectations Are Already Tumbling

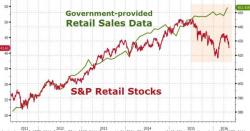
The first quarter earnings season is almost over (91% of companies have reported) and the results, while not quite as dire as forecast just over a month ago, still led to the worst quarterly report since the financial crisis, mostly due to a widely expected collapse in energy revenues and earnings, however the big surprise was the disappointing misses in numerous consumer and retail stocks, the result of which was a plunge in the retail index...


The Mouths Of Madness - The Grand Delusion Of Central Bankers

The Mouths Of Madness - The Grand Delusion Of Central Bankers

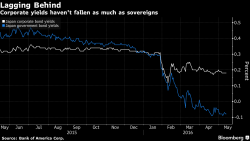
Never before has the Bank of Japan done so much to achieve so little. Even after arranging a record stimulus program and reducing a key interest rate to less than zero, Bloomberg reports that the central bank has failed to boost inflation to its goal of 2 percent. Stocks are trading lower than when Governor Haruhiko Kuroda expanded his package of asset purchases in 2014. Exports are declining. One measure of bank lending is at a 14-year high, though loan growth is slowing compared with a year ago.

Pages