You are here

Business

Small Caps Are Now More Expensive Than At The Peak Of The Tech Bubble
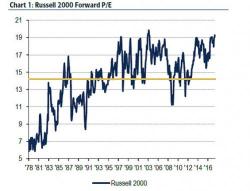
Small Caps Are Now More Expensive Than At The Peak Of The Tech Bubble

Everyone knows that tech stocks are - or at least until investors realized that tax reform is a fiasco for the tech sector, were - the darlings of the market, resulting in the biggest concentration of hedge fund holders with a record number of HFs holding the 5 FAANG stocks; at the same time far fewer are aware that while the tech space trades at less than 50% of its peak "dot com" valuations, it is the small and mid caps that have been the best performing, not to mention most overvalued sectors in recent years.

JPMorgan, BofA See 15% Plunge In Trading Revenues; Blame "Lack Of Volatility, Excitement"

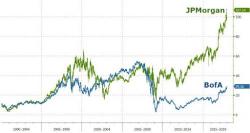
JPMorgan, BofA See 15% Plunge In Trading Revenues; Blame "Lack Of Volatility, Excitement"

Stop us when you've heard this before... and you've heard it exactly two times in the last two quarter: both Bank of America and JPMorgan warning their revenue will be down double digits year over year because volatility is so low, and traders are so paralyzed, there is much less money to be made trading either flow or prop, or simply from collecting commissions.

Well, today marks the third time in the last three quarters when both JPMorgan and Bank of America both said - again - that there hasn’t been a rebound in the relentless slump in trading revenue.

CME Unveils "Weirdest Chart Ever"

CME Unveils "Weirdest Chart Ever"

Authored by Erik Norland via CME Group,

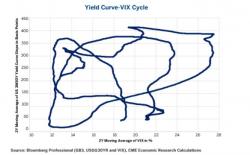
We freely admit: Figure 1 is probably the strangest chart that you will ever see, at least in finance. 

You may be wondering: did they throw blue spaghetti noodle on paper for inspiration and then write an economics article about it?  Or, have they spent too much time with disciples of psychologist Timothy Leary, a proponent of experimenting with psychedelic drugs?

Figure 1: Weirdest Chart Ever

Pages