The $5.6T Pharmaceutical Industry in One Chart

Published
1 hour ago
on
July 31, 2025
| 19 views
-->
By
Julia Wendling
Graphics & Design
Published
1 hour ago
on
July 31, 2025
| 19 views
-->
By
Julia Wendling
Graphics & Design
![]()
See this visualization first on the Voronoi app.
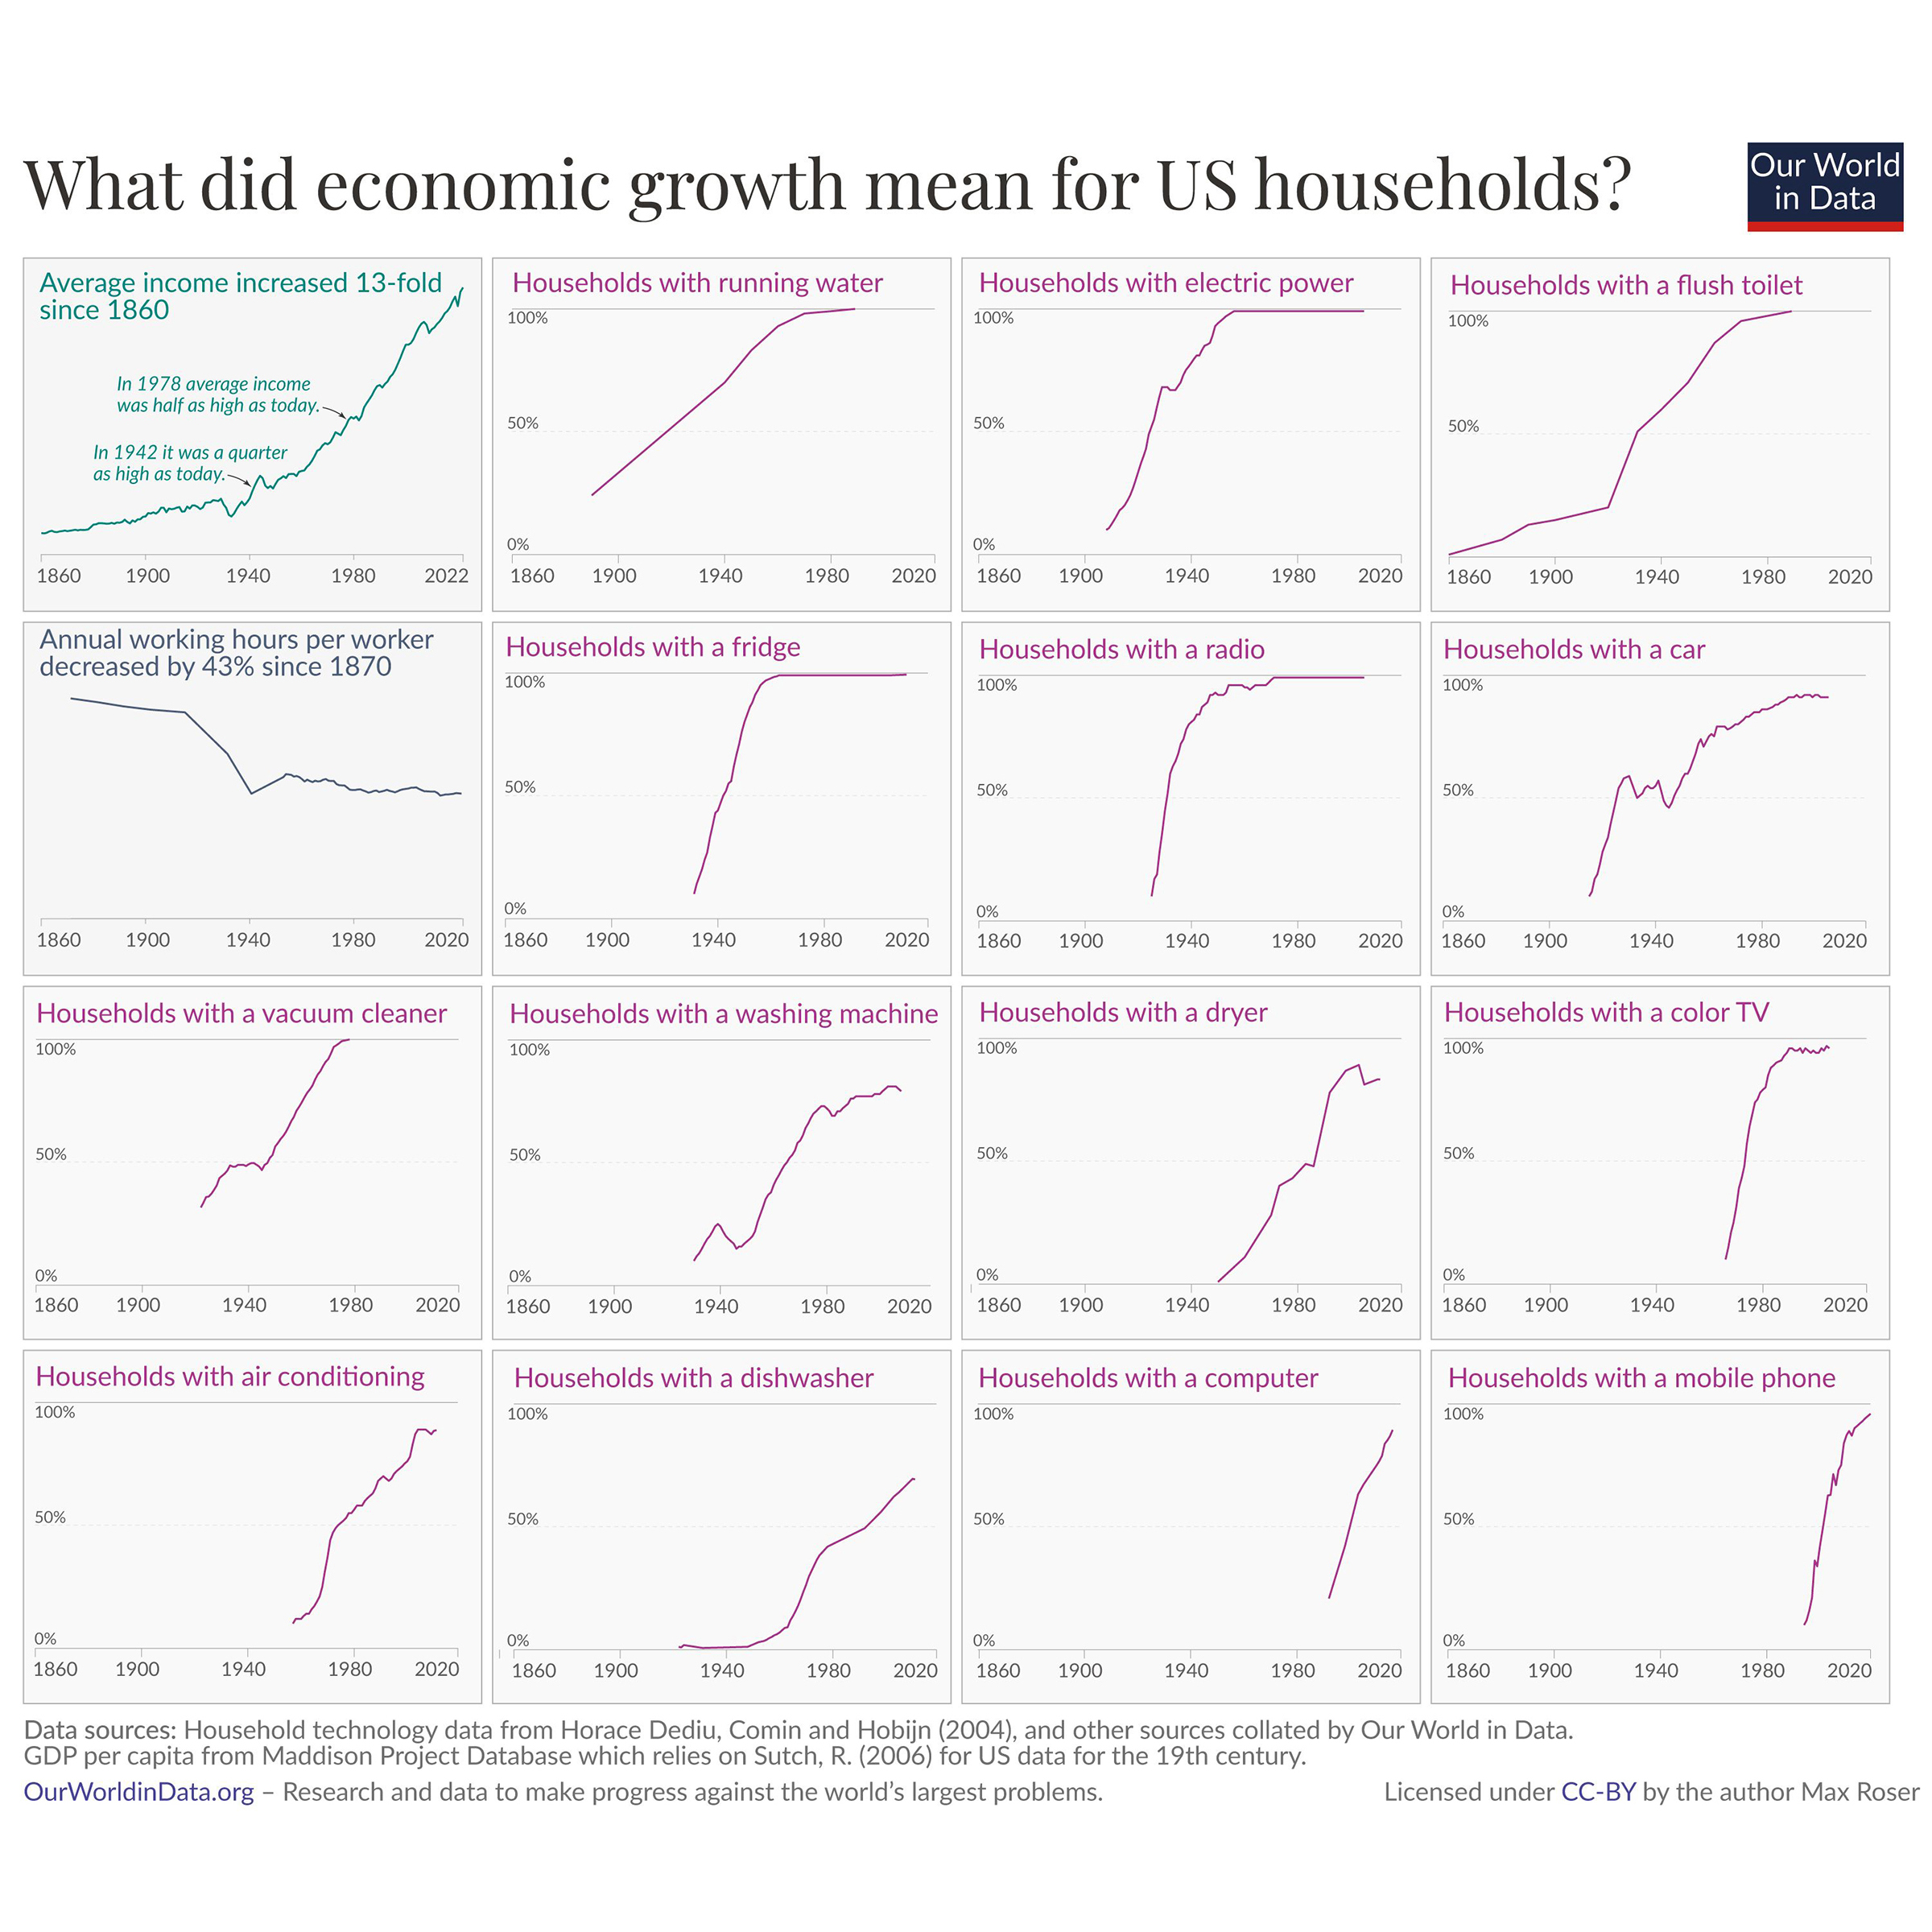
What Did Economic Growth Mean for U.S. Households?
This was originally posted on our Voronoi app. Download the app for free on iOS or Android and discover incredible data‑driven charts from a variety of trusted sources.
![]()
See this visualization first on the Voronoi app.
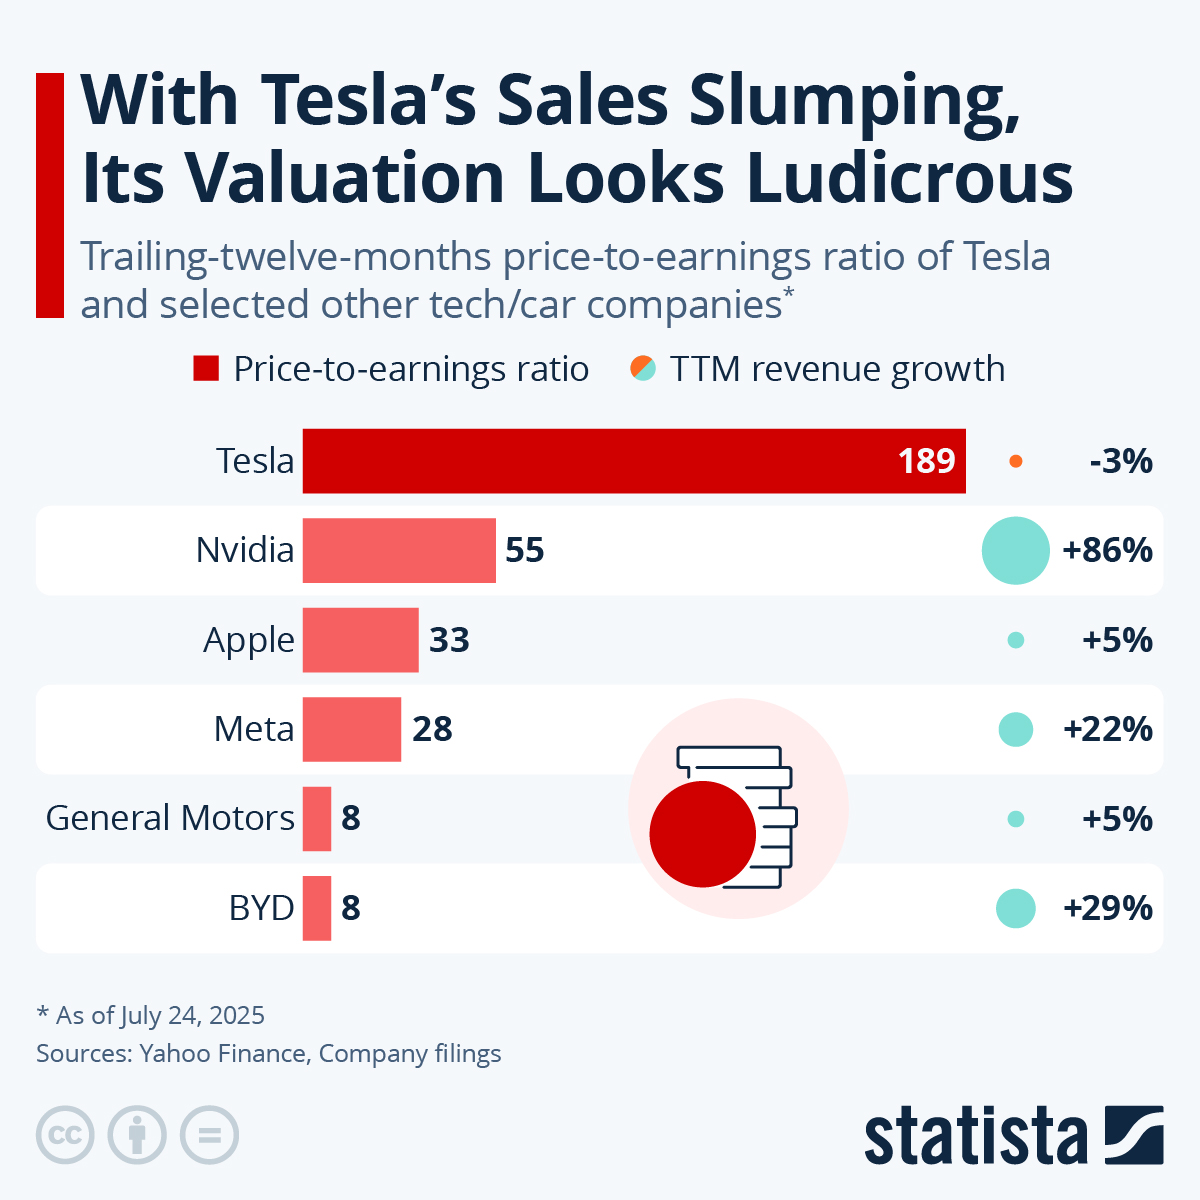
A Critical Look at Tesla’s Valuation
This was originally posted on our Voronoi app. Download the app for free on iOS or Android and discover incredible data‑driven charts from a variety of trusted sources.
![]()
See this visualization first on the Voronoi app.
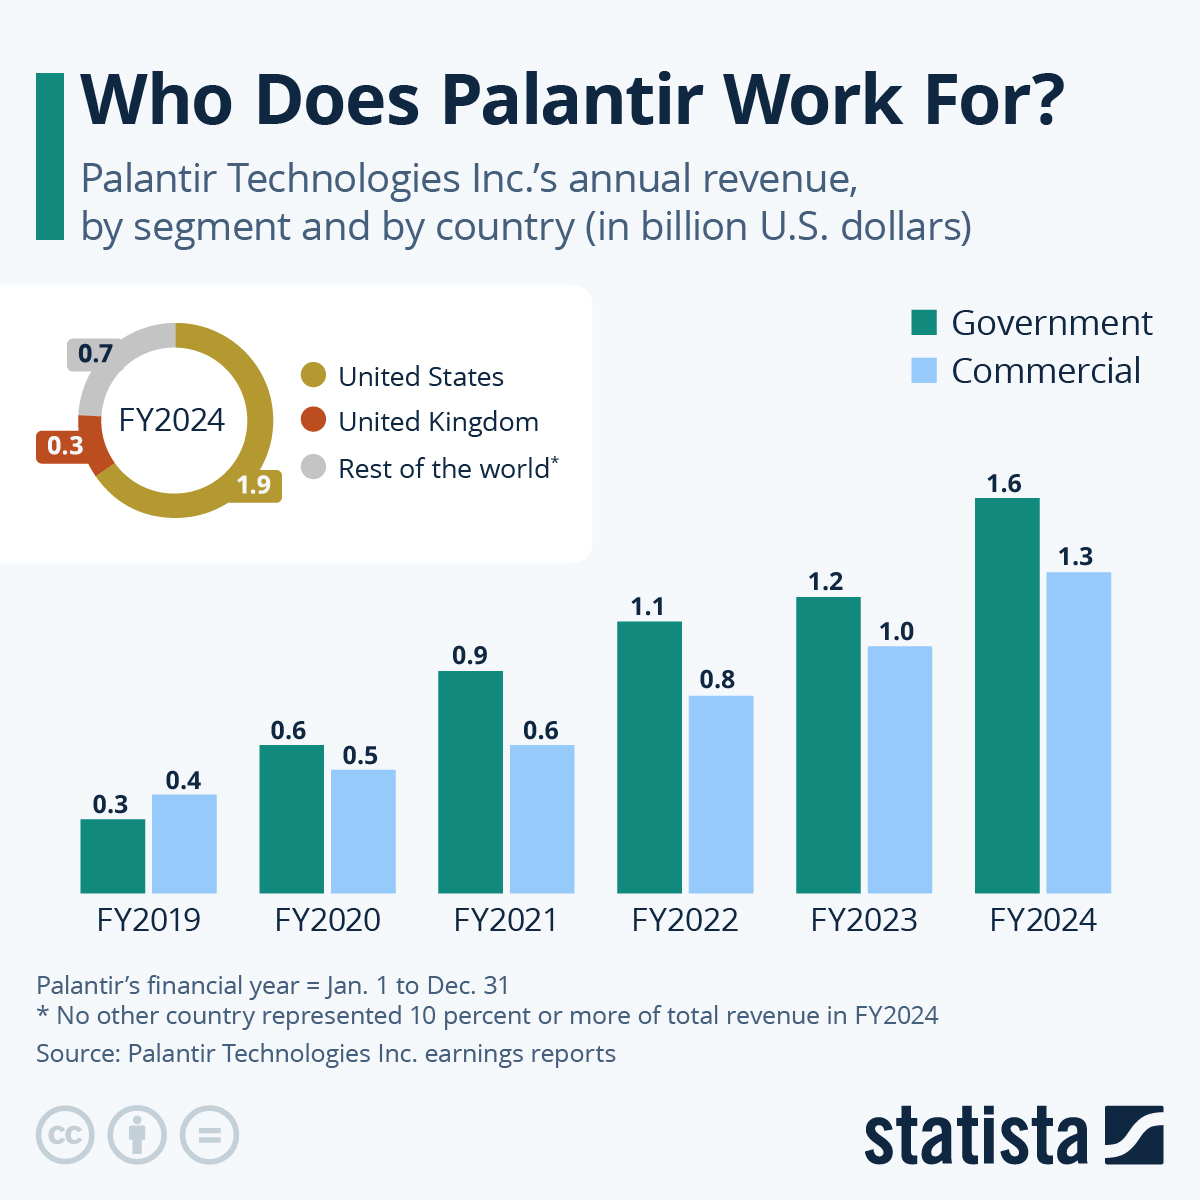
Where Does Palantir’s Revenue Come From?
This was originally posted on our Voronoi app. Download the app for free on iOS or Android and discover incredible data‑driven charts from a variety of trusted sources.
![]()
See this visualization first on the Voronoi app.
Use This Visualization
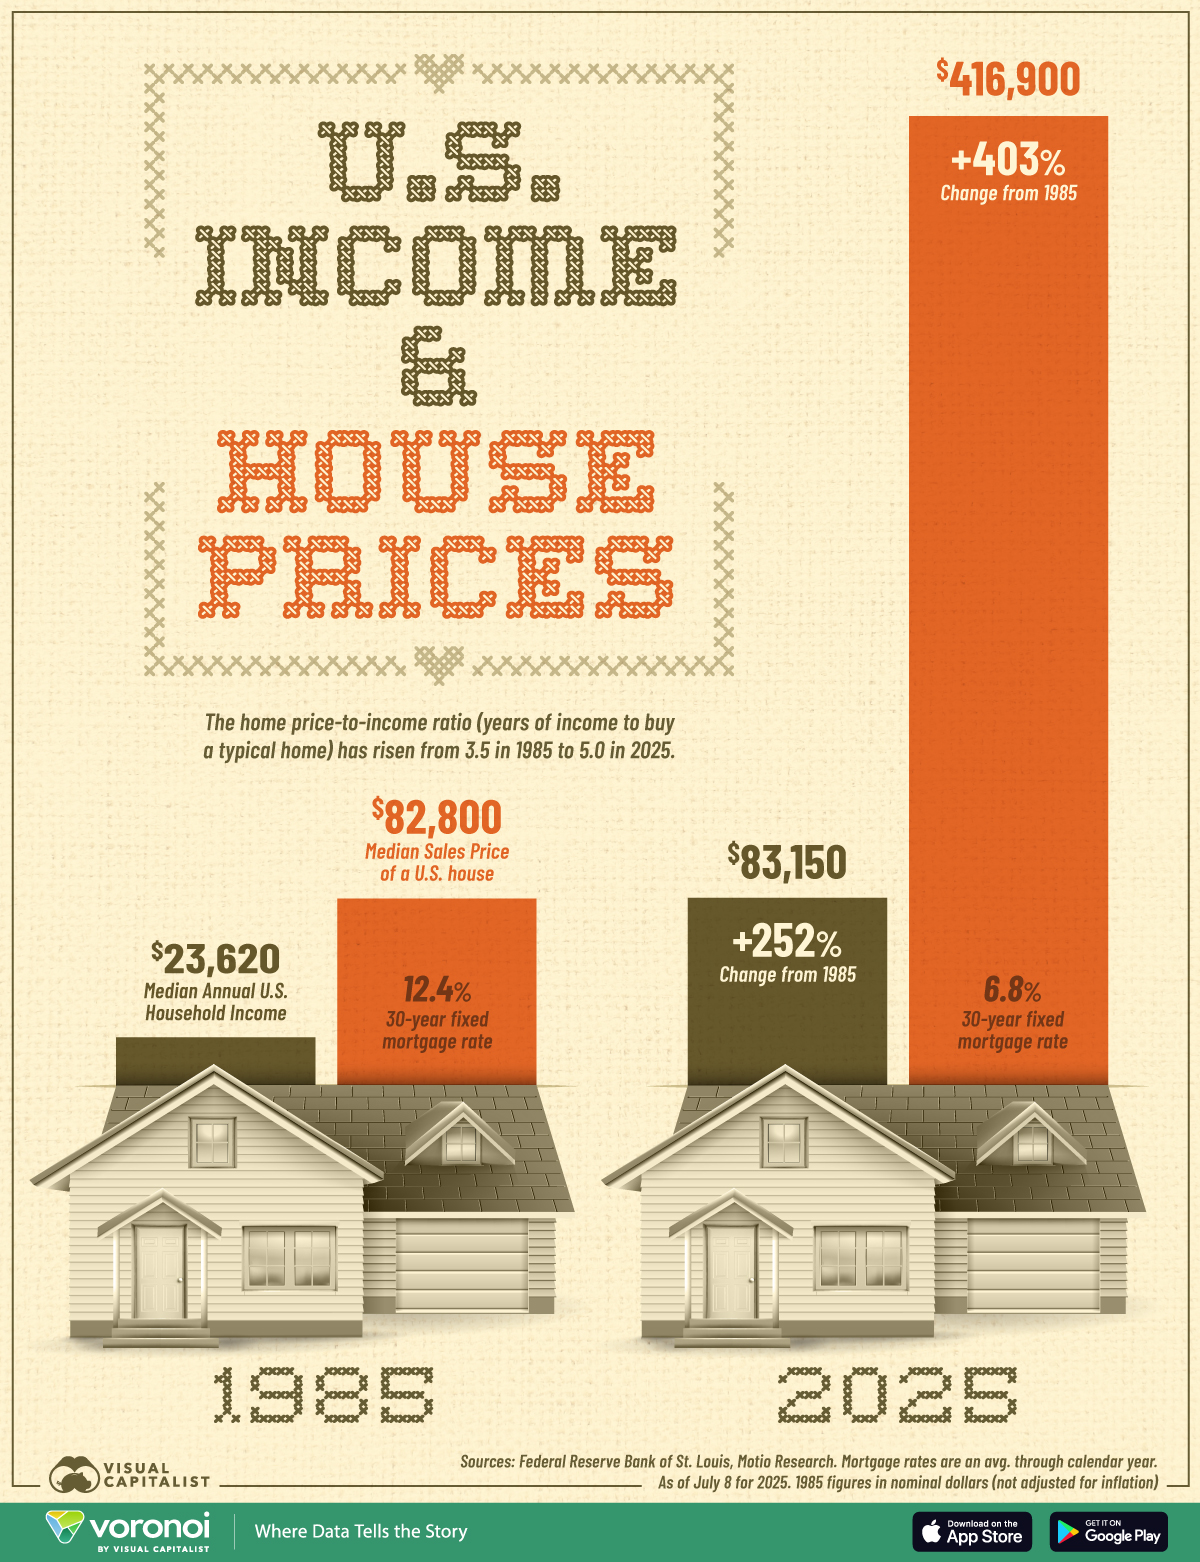
Charted: American Income vs. Home Prices (1985–2025)
This was originally posted on our Voronoi app. Download the app for free on iOS or Android and discover incredible data-driven charts from a variety of trusted sources.
Key Takeaways