![]()
See this visualization first on the Voronoi app.
Use This Visualization
Charted: America’s GDP Decline in Q1 2025
This was originally posted on our Voronoi app. Download the app for free on iOS or Android and discover incredible data-driven charts from a variety of trusted sources.
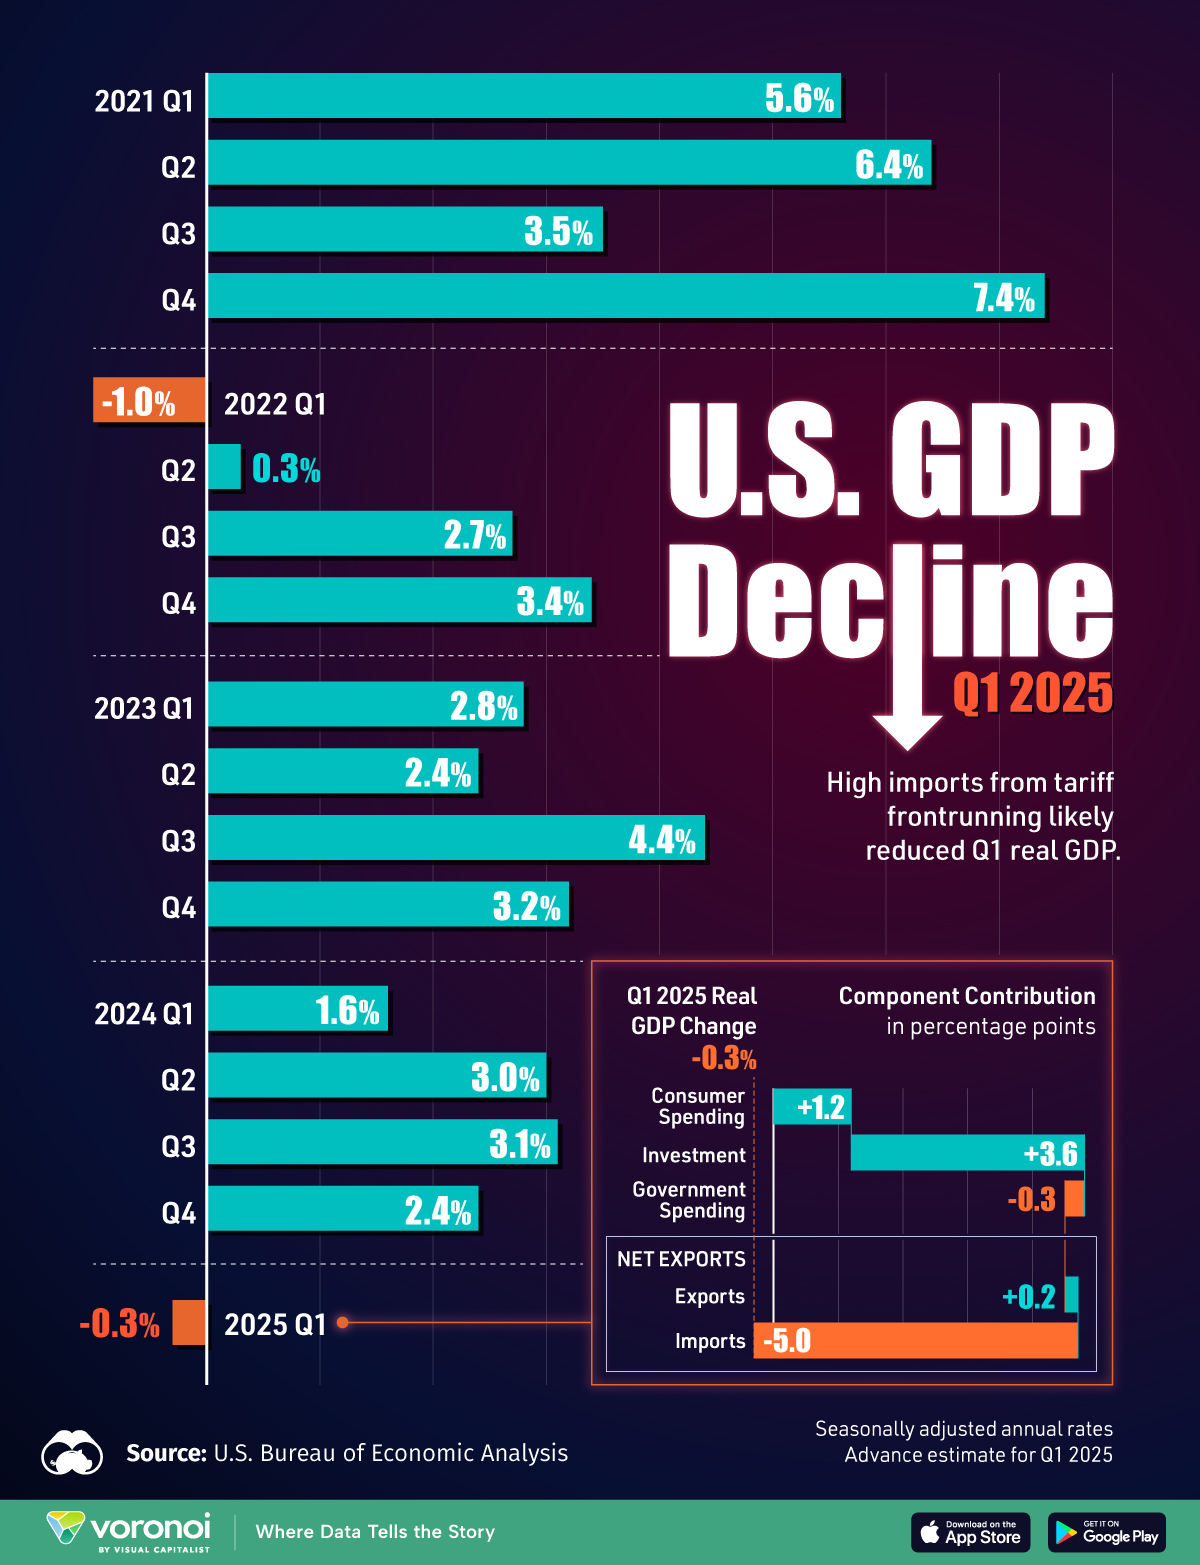
The U.S. economy is starting to show signs of weakness as Q1 2025 real GDP declined amidst the ongoing trade disruptions from Trump’s tariffs and government spending cuts from the Department of Government Efficiency.
This graphic shows the seasonally adjusted annualized advance estimate of U.S. real GDP change by quarter since 2021, using data from the U.S. Bureau of Economic Analysis (BEA).
The mini chart breaks down the Q1 2025 real GDP change of -0.3% into the different components that contribute to the final figure.
U.S. GDP Falls for the First Time Since 2022
America’s GDP growth has remained consistently positive post-pandemic, averaging 3.2% from 2021 through to the end of 2024.
However, 2025’s advance estimate of real GDP growth for the U.S. in Q1 came in at -0.3%, the first negative quarter since Q1 of 2022.
The table below shows the data of quarterly real GDP change for the U.S. from 2021 through to Q1 2025:
| Date | U.S. Real GDP Change |
|---|---|
| Q1 2025 | -0.3% |
| Q4 2024 | 2.4% |
| Q3 2024 | 3.1% |
| Q2 2024 | 3.0% |
| Q1 2024 | 1.6% |
| Q4 2023 | 3.2% |
| Q3 2023 | 4.4% |
| Q2 2023 | 2.4% |
| Q1 2023 | 2.8% |
| Q4 2022 | 3.4% |
| Q3 2022 | 2.7% |
| Q2 2022 | 0.3% |
| Q1 2022 | -1.0% |
| Q4 2021 | 7.4% |
| Q3 2021 | 3.5% |
| Q2 2021 | 6.4% |
| Q1 2021 | 5.6% |
It’s worth keeping in mind that these are annual rates, meaning that if 2025’s remaining three quarters are like Q1 economically, U.S. real GDP would decline by -0.3% this year.
Along with this, this is the Bureau of Economic Analysis’ advance estimate of real GDP change for Q1, which will undergo two further revisions and a final annual revision as more economic data is collected and incorporated.
While often granular, these revisions can make a difference. In 2022 for example, after Q1 had negative GDP growth, Q2 2022’s advance estimate showed a negative reading, but was ultimately revised to a positive number in the BEA’s comprehensive annual revision.
Why Did U.S. GDP Decline in Q1 2025?
If we dig a bit deeper into the data which makes up the negative GDP change of Q1 2025, we can see potential footprints of the Trump administration.
Of the key components that make up the calculation for GDP, an elevated level of imports had the biggest drag on growth at -5.0 percentage points. Imports are counted against GDP growth, as they represent spending on foreign rather than domestic production.
The table below shows the component contribution to the -0.3% real GDP change of Q1 2025:
| Component of U.S. GDP Change | Change in Q1 2025 |
|---|---|
| Consumer Spending (goods) | 0.1 pp |
| Consumer Spending (services) | 1.1 pp |
| Investment | 3.6 pp |
| Government spending | -0.3 pp |
| Exports | 0.2 pp |
| Imports | -5.0 pp |
| Q1 2025 Real GDP Change | -0.3% |
This high level of imports is likely due to businesses frontrunning Trump’s import tariffs, also corroborated by the largest build in private inventories of 2.3 pp (the largest build since Q4 of 2021).
The other potential drag on growth from the Trump administration is the decline in government spending of 0.3 pp, with cuts from the Department of Government Efficiency (D.O.G.E.) contributing to this pullback.
On the official website, D.O.G.E. notes that they have terminated around $32 billion in contracts, $37 billion in grants, and $291 million in leases as of May 3rd, 2025.
Learn More on the Voronoi App ![]()
To learn more about how GDP growth forecasts for 2025 have changed in Q1, check out this chart which shows the IMF’s decline in projections for major nations.