Published
7 seconds ago
on
October 2, 2024
| 125 views
-->
By
Selin Oğuz
Article & Editing
- Ryan Bellefontaine
Graphics & Design
- Zack Aboulazm
- Rosey Eason
Data in this visualization comes from the 2024 Annual Utility Decarbonization Report
Dynamic Dozen: The 12 Largest Public Utilities in the U.S.
Public utilities are community-owned, non-profit organizations that supply electricity to local customers. Funded primarily through taxes and service revenues, public utilities are driven by a commitment to serve the public interest rather than generate profits.
In partnership with the National Public Utilities Council, we present the 2024 edition of our Annual Utility Decarbonization Index. The index uses the latest available data from company reports to track the decarbonization progress of the 47 largest investor-owned utilities (IOUs) in the United States.
And for the first time this year, the Index also includes a ranking of the 20 largest public utilities in the U.S. and which ones have the cleanest fuel mixes. So which public utilities contribute the most to the U.S. power grid?
The Top 12 Largest American Public Utilities
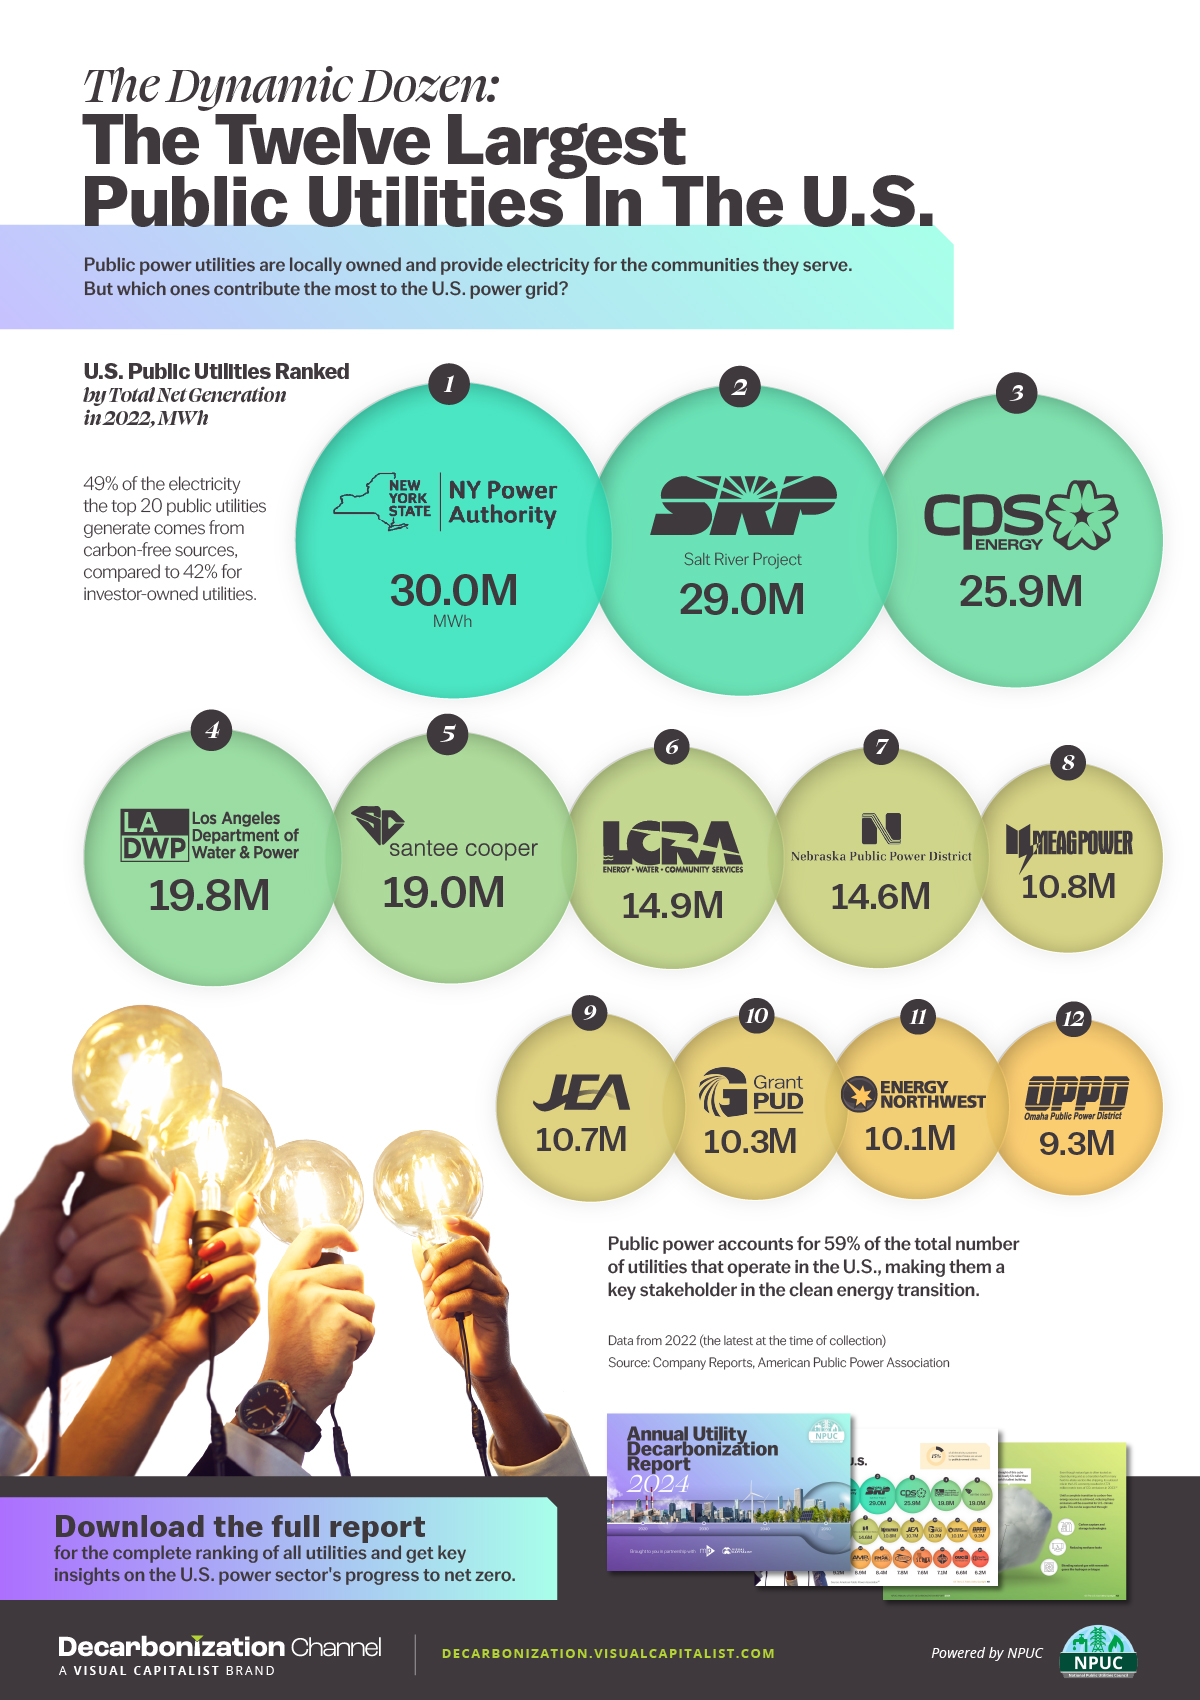
The two largest public utilities contributed nearly 30 million MWh each to the nation’s grid in 2022.
| Company | State | 2022 Total Owned Electricity Generation (MWh) |
|---|---|---|
| New York Power Authority | New York | 29,973,621 |
| Salt River Project | Arizona | 28,963,126 |
| CPS Energy | Texas | 25,946,058 |
| Los Angeles Department of Water & Power | California | 19,846,221 |
| Santee Cooper (South Carolina Public Service Authority) | South Carolina | 18,984,737 |
| Lower Colorado River Authority | Texas | 14,860,017 |
| Nebraska Public Power District | Nebraska | 14,649,116 |
| MEAG Power | Georgia | 10,818,841 |
| JEA | Florida | 10,696,842 |
| Grant County, Public Utility District No. 2 | Washington | 10,278,983 |
| Energy Northwest | Washington | 10,139,460 |
| Omaha Public Power District | Nebraska | 9,335,877 |
The country’s largest public utility, the New York Power Authority, was founded in 1931 by Governor Franklin D. Roosevelt before becoming President and today operates primarily on hydropower.
The runner-up for the highest-producing public utility is the Salt River Project in Arizona. It was founded in 1903 and provides nearly all of the Phoenix metropolitan area with electricity from a variety of sources.
Rounding off the top 10 is the Washington state-based Grant County PUD. The utility was founded in 1938 and today generates 100% of its electricity from hydropower.
Overall, public power accounts for 59% of the total number of utilities operating in the U.S. and provides electricity to two of the largest cities in the country, New York and Los Angeles. Many of the largest public utilities have operated for generations.
Download the 2024 Annual Utility Decarbonization Report
In 2022, 49% of the electricity generated by the top 20 public utilities came from carbon-free sources. For investor-owned utilities, it was 42%. Download the report to see the rest of the largest public utilities.
In addition to the public utilities, there’s much more to explore in the 2024 report, including:
- Inflation Reduction Act impacts
- Market trends for renewables
- Year-to-year progressions
- Fuel mix rankings for the largest public utilities
- Gas utility emissions rankings
Download the 2024 NPUC Annual Utility Decarbonization Report to find out everything you need to know about the clean energy transition in the U.S. power sector.
Related Topics: #renewables #clean energy #investor owned utilities #net zero emissions #climate #NPUC #Motive Power #National public utilities council #partner #annual utility decarbonization report #2024 decarbonization report
Click for Comments
var disqus_shortname = "visualcapitalist.disqus.com";
var disqus_title = "The Dynamic Dozen: The 12 Largest Public Utilities in the U.S.";
var disqus_url = "https://www.visualcapitalist.com/sp/ranked-the-largest-public-utilities-in-the-u-s/";
var disqus_identifier = "visualcapitalist.disqus.com-170772";
You may also like
-

Energy2 days ago
Visualizing the Decline of Copper Usage in EVs
The total copper per vehicle is projected to decrease by 38 kg between 2015 and 2030.
-
Energy6 days ago
Charted: Lithium-Ion Batteries Keep Getting Cheaper
Cell prices have fallen 73% since 2014.
-
Energy2 weeks ago
Ranked: The Largest Producers of Wind Power, by Country
Global wind power capacity hit fresh records in 2023 thanks to strategic government investment and lower technology costs.
-
Green2 weeks ago
Chart: Coal Consumption by Region (1965-2023)
China remains the largest coal consumer, making up 56% of the global total.
-
Urbanization3 weeks ago
Charted: China’s Energy Needs Keep on Rising
After rapid industrialization in the 1990s, mass urbanization is driving demand even higher.
-
Green4 weeks ago
Charted: The World’s Carbon Emissions from Energy Production
The energy sector is the main contributor of greenhouse gas emissions globally. Which countries’ energy sector emits the most CO2?
Subscribe
Please enable JavaScript in your browser to complete this form.Join the 375,000+ subscribers who receive our daily email *Sign Up
The post The Dynamic Dozen: The 12 Largest Public Utilities in the U.S. appeared first on Visual Capitalist.