![]()
See more visualizations like this on the Voronoi app.
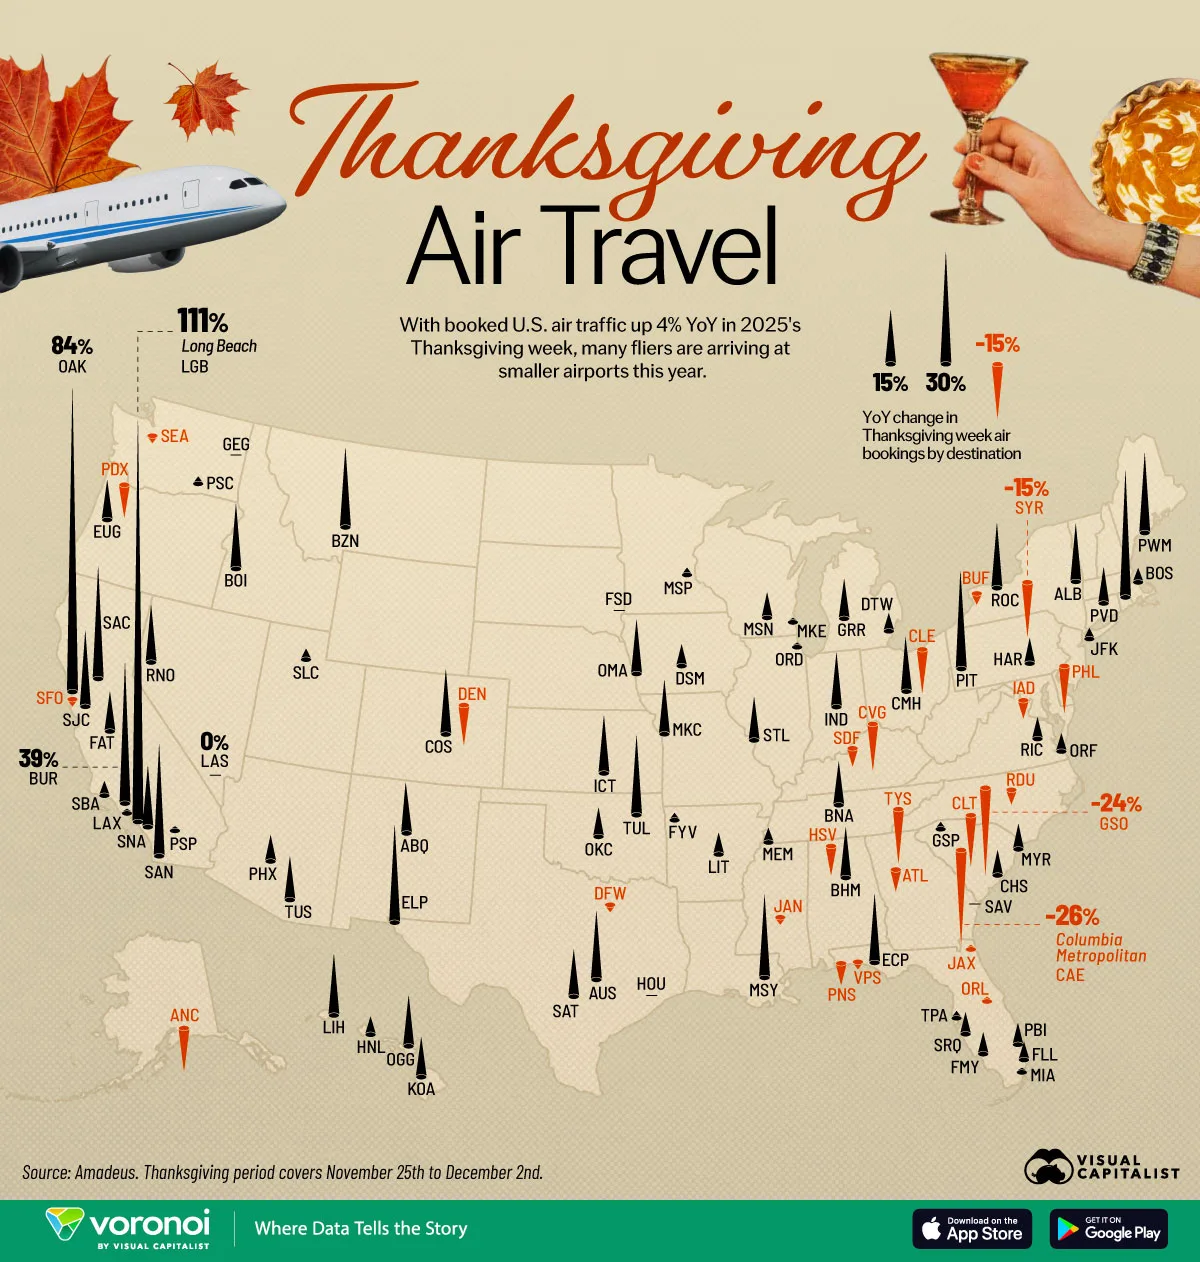
Mapped: Thanksgiving Travel by Airport in 2025
See visuals like this from many other data creators on our Voronoi app. Download it for free on iOS or Android and discover incredible data-driven charts from a variety of trusted sources.
Key Takeaways
- Long Beach (LGB) and Oakland (OAK) show the sharpest increases in Thanksgiving week arrivals, rising 111% and 84%, respectively, year-over-year.
- Major hubs like San Francisco International (SFO) and Hartsfield–Jackson Atlanta (ATL) expect declines in Thanksgiving arrivals, highlighting 2025 travelers’ preference for smaller airports.
Thanksgiving remains one of the busiest travel periods in the United States, with millions of passengers moving through airports nationwide.
This visualization uses data from Amadeus to map out where air traffic is rising the most—and where it is falling—across 100 airports for Thanksgiving week 2025 compared to 2024.
Thanksgiving Air Travel Across the U.S. in 2025
The key trend in Thanksgiving air travel for 2025 is that smaller regional airports are experiencing surges in arrivals while major hubs are seeing notable pullbacks.
The data table below shows the year-over-year change in scheduled Thanksgiving week arrivals for 100 U.S. airports. Thanksgiving week is defined as the period from November 25th to December 2nd.
| Airport code | Destination airport | Annual change in Thanksgiving week (2025) arrivals |
|---|---|---|
| LGB | Long Beach Airport (Daugherty Field) | 111% |
| OAK | San Francisco Bay Oakland International Airport | 84% |
| BUR | Hollywood Burbank Airport | 39% |
| PVD | Theodore Francis Green State Airport | 35% |
| SAC | Sacramento Executive Airport | 31% |
| SAN | San Diego International Airport | 31% |
| ELP | El Paso International Airport | 27% |
| PIT | Pittsburgh International Airport | 27% |
| MSY | Louis Armstrong New Orleans International Airport | 23% |
| BZN | Bozeman Yellowstone International Airport | 22% |
| PWM | Portland International Jetport | 22% |
| TUL | Tulsa International Airport | 22% |
| SJC | Norman Y. Mineta San Jose International Airport | 21% |
| AUS | Austin Bergstrom International Airport | 19% |
| ECP | Northwest Florida Beaches International Airport | 19% |
| COS | City of Colorado Springs Municipal Airport | 18% |
| ROC | Frederick Douglass Greater Rochester International Airport | 18% |
| BOI | Boise Air Terminal/Gowen Field | 18% |
| SNA | John Wayne Orange County International Airport | 17% |
| LIH | Lihue Airport | 17% |
| RNO | Reno Tahoe International Airport | 16% |
| ICT | Wichita Eisenhower National Airport | 16% |
| ALB | Albany International Airport | 16% |
| CMH | John Glenn Columbus International Airport | 15% |
| IND | Indianapolis International Airport | 15% |
| MKC | Charles B. Wheeler Downtown Airport | 15% |
| OMA | Eppley Airfield | 15% |
| BHM | Birmingham-Shuttlesworth International Airport | 14% |
| OGG | Kahului International Airport | 14% |
| ABQ | Albuquerque International Sunport | 14% |
| SAT | San Antonio International Airport | 13% |
| STL | St. Louis Lambert International Airport | 12% |
| TUS | Tucson International Airport / Morris Air National Guard Base | 12% |
| BNA | Nashville International Airport | 12% |
| FAT | Fresno Yosemite International Airport | 11% |
| EUG | Mahlon Sweet Field | 11% |
| GRR | Gerald R. Ford International Airport | 11% |
| KOA | Ellison Onizuka Kona International Airport at Keahole | 11% |
| HFD | Hartford Brainard Airport | 10% |
| OKC | Will Rogers World Airport | 8% |
| MYR | Myrtle Beach International Airport | 7% |
| MSN | Dane County Regional Truax Field | 7% |
| PHX | Phoenix Sky Harbor International Airport | 7% |
| CHS | Charleston International Airport | 7% |
| HAR | Capital City Airport | 7% |
| LIT | Bill & Hillary Clinton National Airport/Adams Field | 6% |
| PBI | Palm Beach International Airport | 6% |
| RIC | Richmond International Airport | 6% |
| SRQ | Sarasota Bradenton International Airport | 6% |
| DSM | Des Moines International Airport | 6% |
| FMY | Page Field | 6% |
| HNL | Daniel K. Inouye International Airport | 5% |
| FLL | Fort Lauderdale Hollywood International Airport | 5% |
| ORF | Norfolk International Airport | 5% |
| DTW | Detroit Metropolitan Wayne County Airport | 5% |
| BOS | Logan International Airport | 4% |
| MEM | Memphis International Airport | 4% |
| SBA | Santa Barbara Municipal Airport | 4% |
| JFK | John F. Kennedy International Airport | 3% |
| SLC | Salt Lake City International Airport | 3% |
| TPA | Tampa International Airport | 2% |
| PSC | Tri Cities Airport | 2% |
| GSP | Greenville Spartanburg International Airport | 2% |
| FYV | Drake Field | 2% |
| MSP | Minneapolis–Saint Paul International Airport / Wold‚ Chamberlain Field | 2% |
| MKE | General Mitchell International Airport | 1% |
| LAX | Los Angeles International Airport | 1% |
| ORD | Chicago O'Hare International Airport | 1% |
| MIA | Miami International Airport | 1% |
| PSP | Palm Springs International Airport | 1% |
| GEG | Spokane International Airport | 0% |
| FSD | Sioux Falls Regional Airport / Joe Foss Field | 0% |
| SAV | Savannah Hilton Head International Airport | 0% |
| LAS | Harry Reid International Airport | 0% |
| HOU | William P Hobby Airport | 0% |
| JAX | Jacksonville International Airport | -1% |
| ORL | Orlando Executive Airport | -1% |
| JAN | Jackson-Medgar Wiley Evers International Airport | -2% |
| VPS | Destin-Fort Walton Beach Airport | -2% |
| SFO | San Francisco International Airport | -2% |
| DFW | Dallas/Fort Worth International Airport | -2% |
| SEA | Seattle‚ Tacoma International Airport | -2% |
| BUF | Buffalo Niagara International Airport | -3% |
| RDU | Raleigh Durham International Airport | -4% |
| SDF | Louisville Muhammad Ali International Airport | -5% |
| IAD | Washington Dulles International Airport | -5% |
| ATL | Hartsfield–Jackson Atlanta International Airport | -6% |
| PNS | Pensacola International Airport | -6% |
| HSV | Huntsville International Carl T. Jones Field | -8% |
| PDX | Portland International Airport | -9% |
| DEN | Denver International Airport | -11% |
| ANC | Ted Stevens Anchorage International Airport | -12% |
| CLE | Cleveland Hopkins International Airport | -12% |
| PHL | Philadelphia International Airport | -13% |
| CVG | Cincinnati Northern Kentucky International Airport | -13% |
| CLT | Charlotte Douglas International Airport | -14% |
| TYS | McGhee Tyson Airport | -15% |
| SYR | Syracuse Hancock International Airport | -15% |
| GSO | Piedmont Triad International Airport | -24% |
| CAE | Columbia Metropolitan Airport | -26% |
Across the dataset, changes range from a 111% surge at Long Beach Airport (LGB) to a 26% decline at Columbia Metropolitan Airport (CAE).
While Thanksgiving week air bookings in 2025 have increased 4% compared to last year, mid-sized and secondary airports have seen 9% growth, suggesting travelers are being more deliberate about their destinations as they try to avoid congestion.
West Coast Airports Lead Thanksgiving Arrivals Growth
The strongest growth appears at several California airports. Long Beach (111%), Oakland (84%), and Burbank (39%) rank as the top three increases in Thanksgiving airport destinations in 2025.
These gains suggest that travelers are favoring secondary West Coast airports, especially as San Francisco International Airport sees a 2% decline.
Sacramento Executive Airport (SAC) and San Diego International Airport also both feature a notable 31% rise in 2025 compared to last year’s Thanksgiving week.
Providence’s Theodore Francis Green Memorial State Airport (PVD) posts a 35% increase—one of the stronger gains outside the West Coast.
Thanksgiving Travel Declines Concentrated in the Southeast
The steepest declines in Thanksgiving arrivals in 2025 compared to last year are primarily across Southern airports.
Columbia (CAE) sees a 26% decline, followed closely by Greensboro’s Piedmont Triad (GSO) at -24%.
Other airports such as McGhee Tyson (TYS) in Tennessee, Syracuse Hancock (SYR) in New York, and Charlotte Douglas (CLT) in North Carolina also show double-digit decreases.
Overall, some of the country’s largest airports are seeing significant declines, like Atlanta International Airport (the world’s busiest airport in 2024) expecting 6% fewer arrivals compared to last year.
Other major airports with declines include Dallas/Fort Worth (-2%), Denver International (-11%), and Philadelphia International (-13%), all of which expect significant drops in Thanksgiving travel in 2025.
Learn More on the Voronoi App ![]()
To learn more about Thanksgiving in 2025, check out this graphic on the Voronoi app, which breaks down the most affordable grocery stores for Thanksgiving dinner items.