![]()
See more visuals like this on the Voronoi app.
Use This Visualization
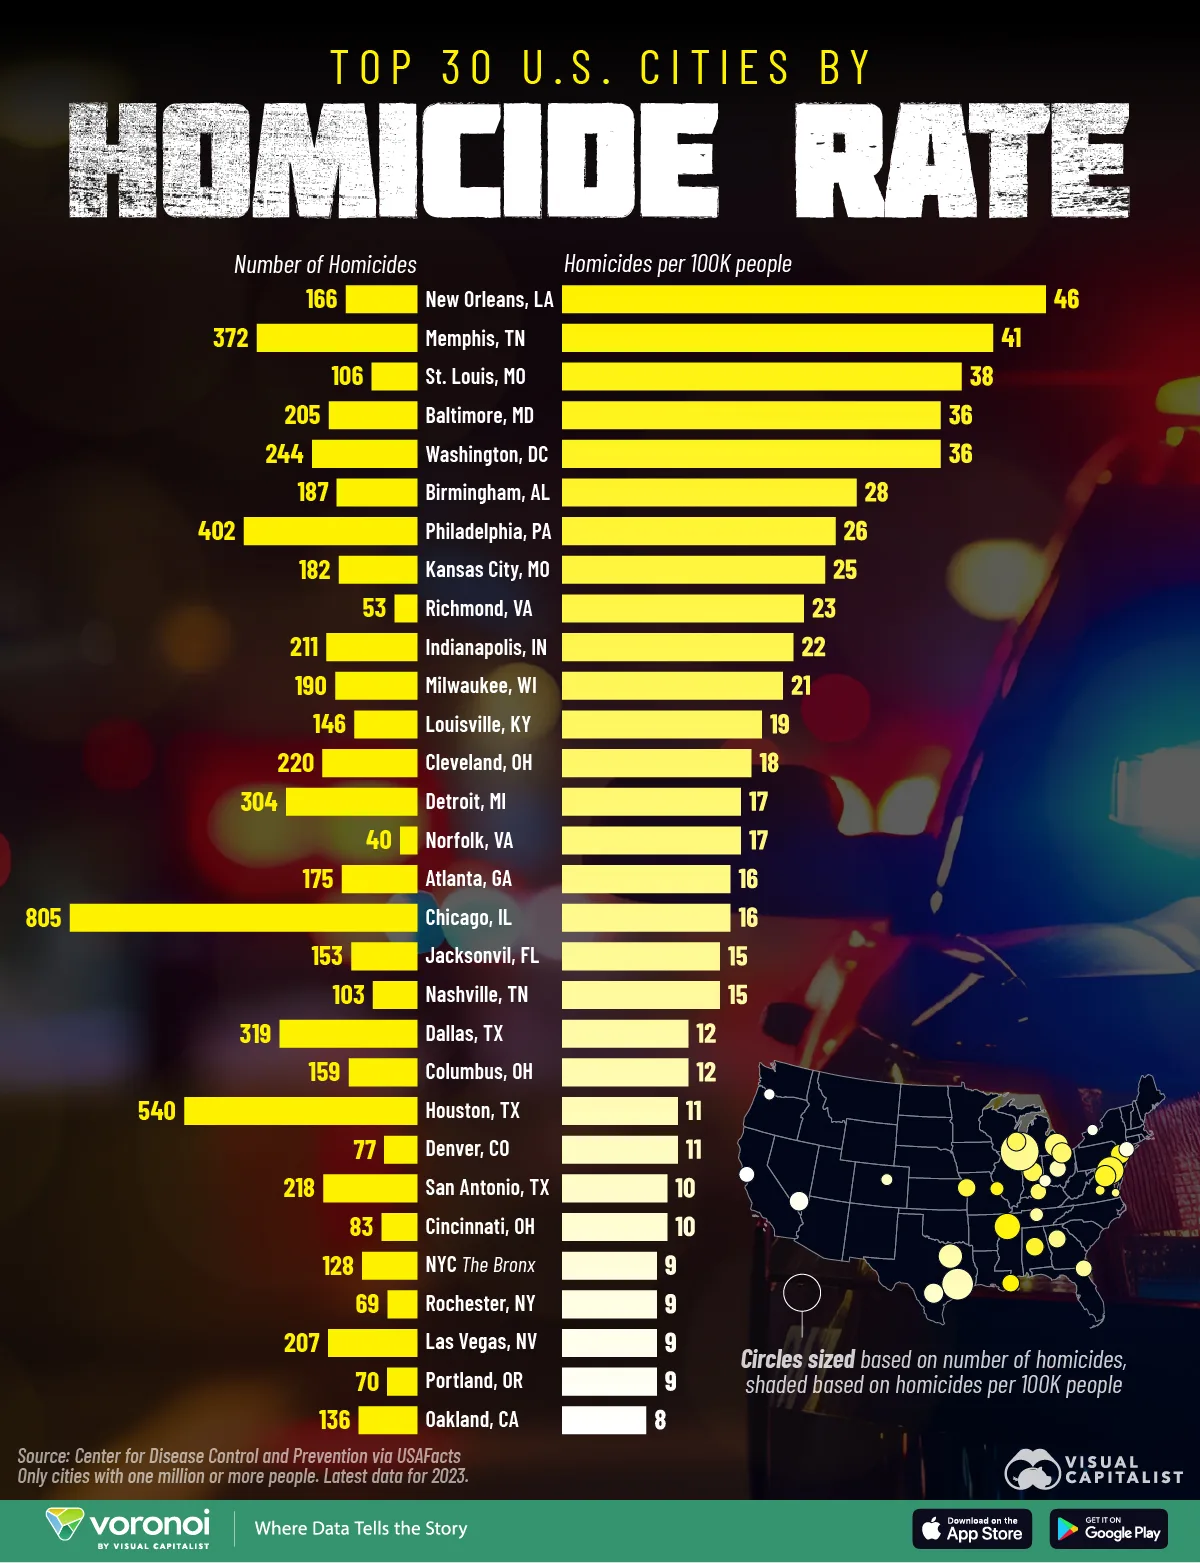
Ranked: Top 30 U.S. Cities by Homicide Rate
See visuals like this from many other data creators on our Voronoi app. Download it for free on iOS or Android and discover incredible data-driven charts from a variety of trusted sources.
Key Takeaways
- New Orleans has the highest homicide rate among major U.S. cities, at 46 homicides per 100,000 people.
- Per capita rates reveal a different picture than total homicides, with some highly populated cities ranking lower despite high absolute numbers.
This visualization highlights the top 30 U.S. cities with the highest homicide rates per 100,000 residents, offering a population-adjusted view that goes beyond raw totals. The data for this visualization comes from the Centers for Disease Control and Prevention via USAFacts.
New Orleans and Memphis Lead the Nation
New Orleans tops the list with 46 homicides per 100,000 people, followed closely by Memphis at 41. Both cities consistently rank near the top due to long-term structural challenges, including poverty, strained social services, and persistent violent crime.
| Rank | Major City | State | Homicides per 100K | Total Homicides |
|---|---|---|---|---|
| 1 | New Orleans | LA | 46 | 166 |
| 2 | Memphis | TN | 41 | 372 |
| 3 | St. Louis | MO | 38 | 106 |
| 4 | Baltimore | MD | 36 | 205 |
| 5 | Washington, DC | 36 | 244 | |
| 6 | Birmingham | AL | 28 | 187 |
| 7 | Philadelphia | PA | 26 | 402 |
| 8 | Kansas City | MO | 25 | 182 |
| 9 | Richmond | VA | 23 | 53 |
| 10 | Indianapolis | IN | 22 | 211 |
| 11 | Milwaukee | WI | 21 | 190 |
| 12 | Louisville | KY | 19 | 146 |
| 13 | Cleveland | OH | 18 | 220 |
| 14 | Detroit | MI | 17 | 304 |
| 15 | Norfolk | VA | 17 | 40 |
| 16 | Atlanta | GA | 16 | 175 |
| 17 | Chicago | IL | 16 | 805 |
| 18 | Jacksonville | FL | 15 | 153 |
| 19 | Nashville | TN | 15 | 103 |
| 20 | Dallas | TX | 12 | 319 |
| 21 | Columbus | OH | 12 | 159 |
| 22 | Houston | TX | 11 | 540 |
| 23 | Denver | CO | 11 | 77 |
| 24 | San Antonio | TX | 10 | 218 |
| 25 | Cincinnati | OH | 10 | 83 |
| 26 | New York City (The Bronx) | NY | 9 | 128 |
| 27 | Rochester | NY | 9 | 69 |
| 28 | Las Vegas | NV | 9 | 207 |
| 29 | Portland | OR | 9 | 70 |
| 30 | Oakland | CA | 8 | 136 |
| 31 | Oklahoma City | OK | 8 | 66 |
| 32 | Phoenix | AZ | 7 | 337 |
| 33 | Pittsburgh | PA | 8 | 98 |
| 34 | Charlotte | NC | 8 | 90 |
| 35 | Orlando | FL | 7 | 104 |
| 36 | Minneapolis | MN | 7 | 88 |
| 37 | Los Angeles | CA | 7 | 659 |
| 38 | Miami | FL | 7 | 176 |
| 39 | Newark | NJ | 7 | 56 |
| 40 | Virginia Beach | VA | 6 | 29 |
| 41 | Seattle | WA | 6 | 141 |
| 42 | Saint Paul | MN | 6 | 33 |
| 43 | Fort Worth | TX | 6 | 134 |
| 44 | Buffalo | NY | 6 | 57 |
| 45 | Tampa | FL | 6 | 90 |
| 46 | Grand Rapids | MI | 6 | 37 |
| 47 | Sacramento | CA | 5 | 86 |
| 48 | Austin | TX | 5 | 71 |
| 49 | New York City (Brooklyn) | NY | 5 | 130 |
| 50 | San Francisco | CA | 5 | 41 |
St. Louis and Baltimore also remain among the highest-rate cities. Together, these cities highlight the concentration of elevated homicide levels in portions of the South and Midwest.
Large Cities Show Lower Rates Despite High Total Homicides
Chicago, for example, recorded more than 800 homicides but ranks 16th with a rate of 16 per 100,000.
Houston, Los Angeles, and New York City boroughs show similar patterns. These cases demonstrate why total homicide numbers can be misleading when comparing risk across cities.
Mid-Sized Cities Also Experience Elevated Rates
Cities like Richmond, Indianapolis, and Milwaukee register rates between 20 and 23 per 100,000, placing them among the top 15 nationally. Although smaller in population, these mid-sized cities face similar drivers of violent crime found in larger metropolitan areas.
Learn More on the Voronoi App ![]()
If you enjoyed today’s post, check out Mapped: U.S. Income Inequality by State on Voronoi, the new app from Visual Capitalist.