![]()
See this visualization first on the Voronoi app.
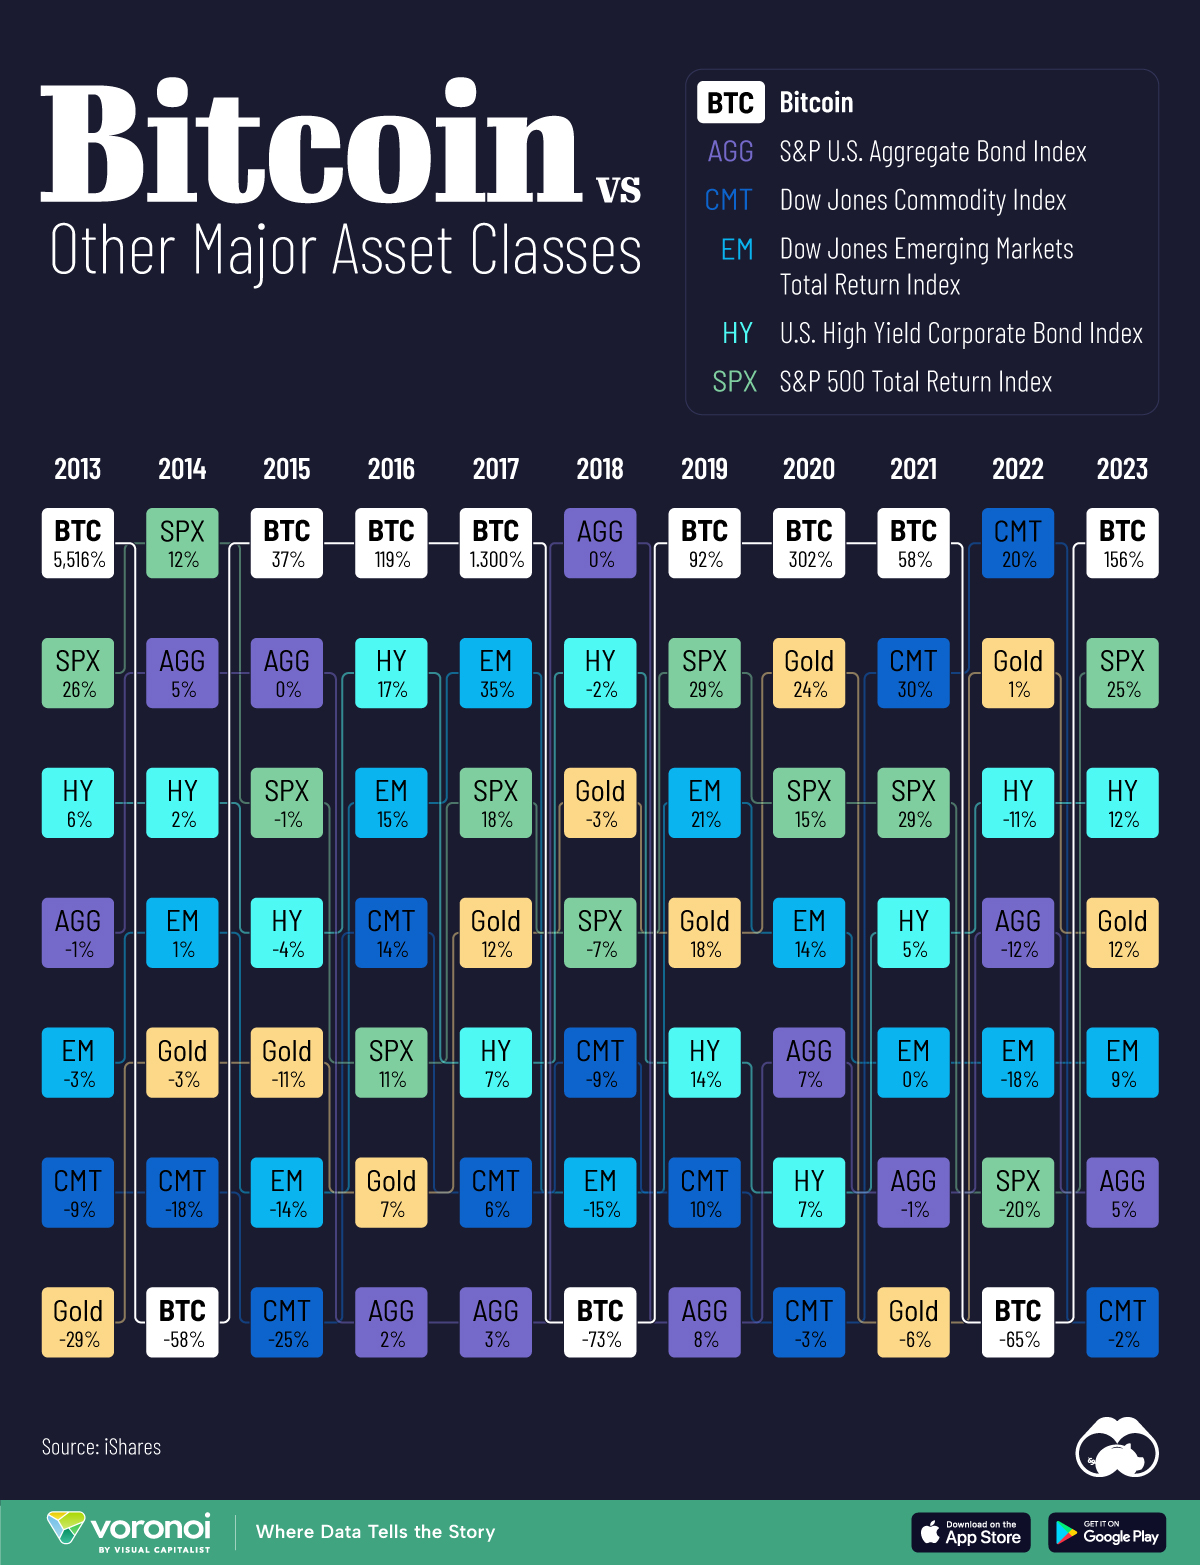
Bitcoin Returns vs. Major Asset Classes
This was originally posted on our Voronoi app. Download the app for free on iOS or Android and discover incredible data-driven charts from a variety of trusted sources.
The crypto winter finally came to an end in 2023, as bitcoin soared 156% over the year.
Not only did the cryptocurrency outperform all major asset classes, it saw its best year since 2020. Several factors drove prices higher, including anticipation for the launch of 11 bitcoin ETFs, which would make crypto more accessible to a broader investor base.
This graphic shows bitcoin returns compared to major asset classes, based on data from iShares.
How Bitcoin Stacks Up
Below, we show annual bitcoin returns, highlighting the outsized volatility compared to assets like stocks, bonds, and commodities:
| Asset Returns | 2023 | 2022 | 2021 |
|---|---|---|---|
| Bitcoin | +156% | -65% | +58% |
| S&P 500 | +25% | -20% | +29% |
| High Yield Corporate Bonds | +12% | -11% | +5% |
| Gold | +12% | +1% | -6% |
| Emerging Markets | +9% | -18% | +0% |
| Bonds | +5% | -12% | -1% |
| Commodities | -2% | +20% | +30% |
As a risk asset, bitcoin jumped in value given hopes that the Federal Reserve would cut interest rates in 2024.
Positive sentiment also increased leading up to the halving event in 2024, which happens every four years. Halving is the process where the reward for mining a bitcoin is halved, which means that miners are awarded 50% lower rewards for verifying transactions. In turn, this reduces the rate of money supply growth, which may cause prices to rise if demand remains elevated.
By comparison, the S&P 500 posted 25% returns in 2023, rising above its historical average of 11.5% while U.S. bonds saw 5% returns.
Bitcoin Returns Over the Last Decade
From a longer perspective, here’s how bitcoin has performed since 2013:
| Year | Bitcoin Performance |
|---|---|
| 2013 | 5,516% |
| 2014 | -58% |
| 2015 | 37% |
| 2016 | 119% |
| 2017 | 1,300% |
| 2018 | -73% |
| 2019 | 92% |
| 2020 | 302% |
| 2021 | 58% |
| 2022 | -65% |
| 2023 | 156% |
On average, it has returned 671% per year, with the strongest returns in 2013 when it skyrocketed over 5,000%—climbing from $13 to $1,100.
Between 2017 and 2019, bitcoin saw another impressive run as prices climbed to $20,000 as it become more well known to the wider public. At the same time, a wave of cryptocurrencies entered the market. Later, in 2021, bitcoin reached all-time highs of $64,899, launching into a $1 trillion asset class.
Whether or not bitcoin continues to rally is anyones guess, but several factors look promising given new regulatory approvals for ETFs, potential monetary easing, and the upcoming halving event in April 2024.
The post Visualized: Bitcoin Returns vs. Major Asset Classes appeared first on Visual Capitalist.