![]()
See this visualization first on the Voronoi app.
Use This Visualization
China’s Economy By Sector in 2024
This was originally posted on our Voronoi app. Download the app for free on iOS or Android and discover incredible data-driven charts from a variety of trusted sources.
China’s economy—driven by a diverse mix of sectors including manufacturing, agriculture, and a rapidly growing tech sector—is navigating a complex landscape amid an ongoing tariff war with the United States, one of its top export markets.
Despite external pressures and concerns over weak domestic demand, the country’s economy grew more than expected in the last quarter of 2024.
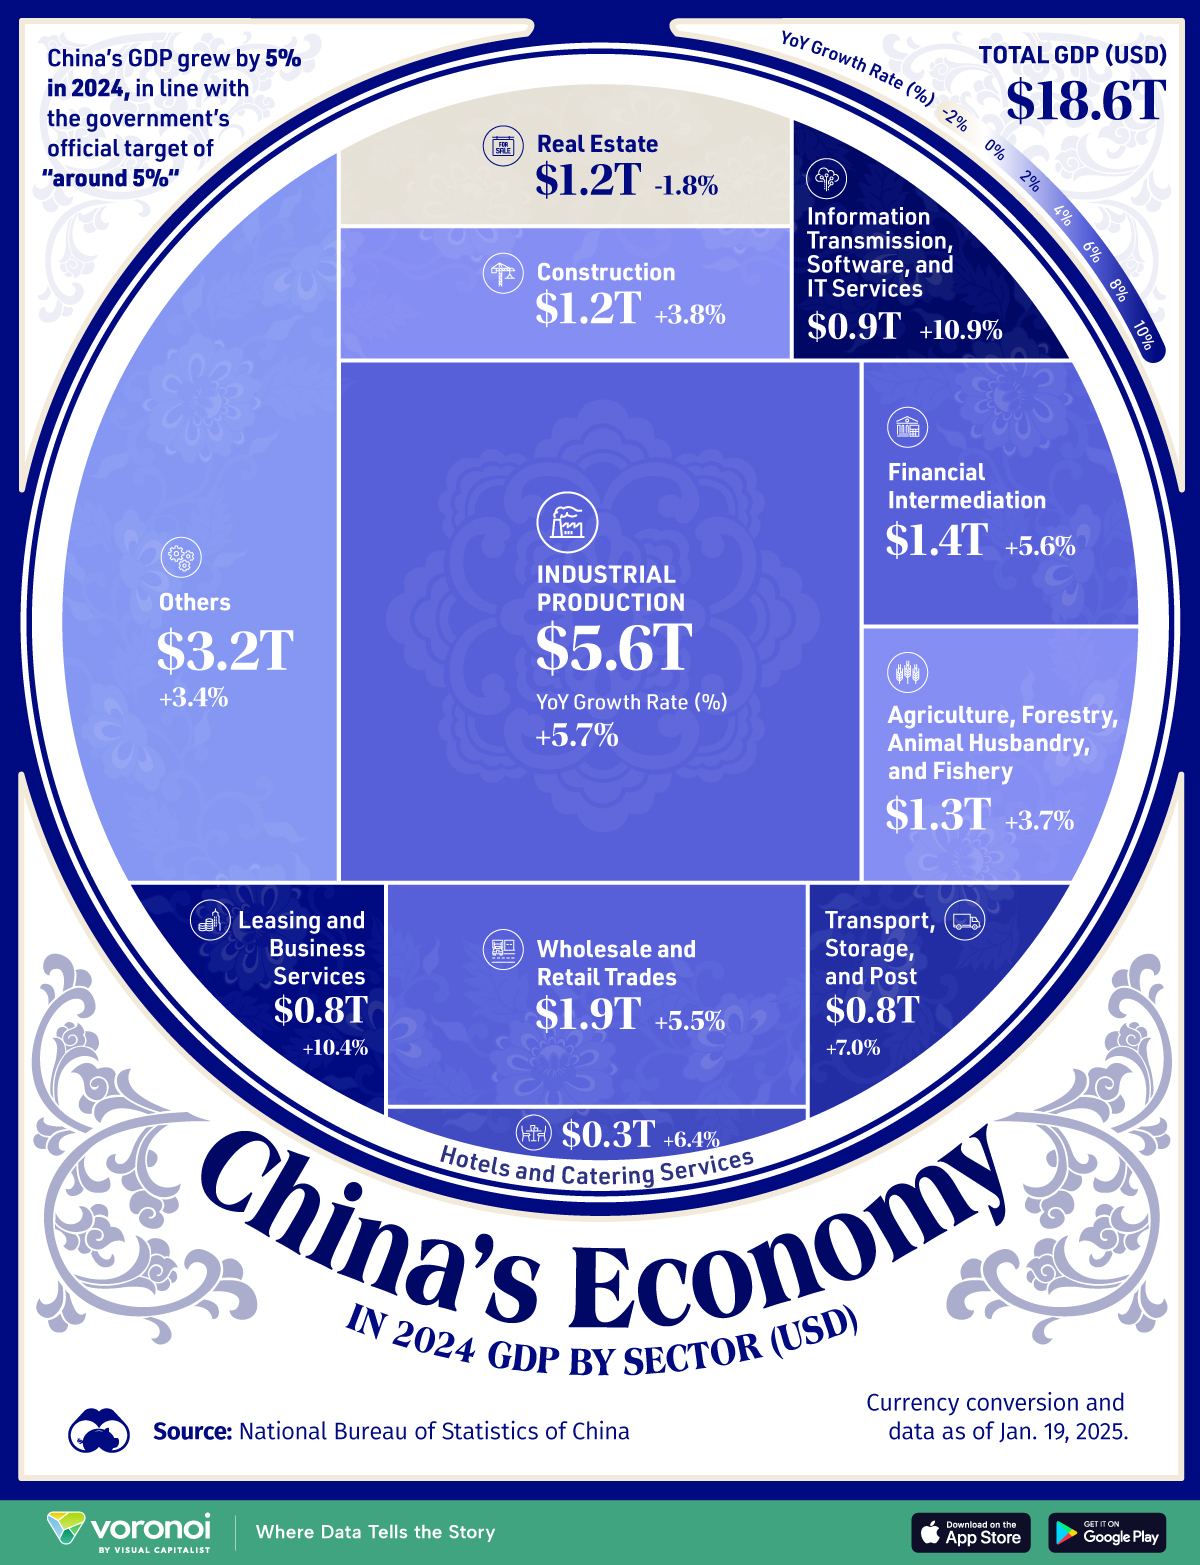
This visualization breaks down China’s $18.6 trillion GDP in U.S. dollars by sector in 2024.
The currency conversion and data are as of Jan. 19, 2025. Data comes from the National Bureau of Statistics of China.
What Was China’s GDP in 2024?
Below, we show China’s $18.6 trillion economy in 2024 broken down by sector, as well as each sector’s year-over-year growth.
| Sector | GDP (Trillions of USD) | Share of GDP | YoY Growth Rate |
|---|---|---|---|
| Industry | $5.6 | 30.1% | +5.7% |
| Wholesale and retail trades | $1.9 | 10.2% | +5.5% |
| Financial intermediation | $1.4 | 7.3% | +5.6% |
| Agriculture, forestry, animal husbandry, and fishery | $1.3 | 7.2% | +3.7% |
| Construction | $1.2 | 6.7% | +3.8% |
| Real estate | $1.2 | 6.3% | -1.8% |
| Information transmission, software, and IT services | $0.9 | 4.7% | +10.9% |
| Transport, storage, and post | $0.8 | 4.4% | +7.0% |
| Leasing and business services | $0.8 | 4.2% | +10.4% |
| Hotels and catering services | $0.3 | 1.8% | +6.4% |
| Others | $3.2 | 17.2% | +3.4% |
In 2024, China’s GDP grew by 5%, which was in line with the government’s official target of “around 5%”. China has kept its 5% target for 2025, even amid its escalating trade war with the United States.
The country’s real estate sector was the only sector to contract last year, due to weak demand, an oversupply of unsold housing inventory, and financial distress among developers.
Industrial production, including manufacturing, continues to be China’s largest industry. Lower cost labor and government initiatives have propelled the country’s rise as a manufacturing powerhouse.
By 2030, China is projected to make up 45% of global manufacturing value added, up from 6% in 2000.
Information transmission, software, and IT services, which includes telecoms and large tech companies like Alibaba and Tencent, saw the greatest year-over-year GDP growth.
Chinese tech firms have been ramping up their development of new AI models, with companies like DeepSeek and Baidu releasing their own large language models to compete globally.
Learn More on the Voronoi App ![]()
Interested in more economic voronoi diagrams? Check out this graphic that visualizes America’s $19 trillion consumer economy.