![]()
See this visualization first on the Voronoi app.
Use This Visualization
Visualizing Global Energy Production in 2023
This was originally posted on our Voronoi app. Download the app for free on iOS or Android and discover incredible data-driven charts from a variety of trusted sources.
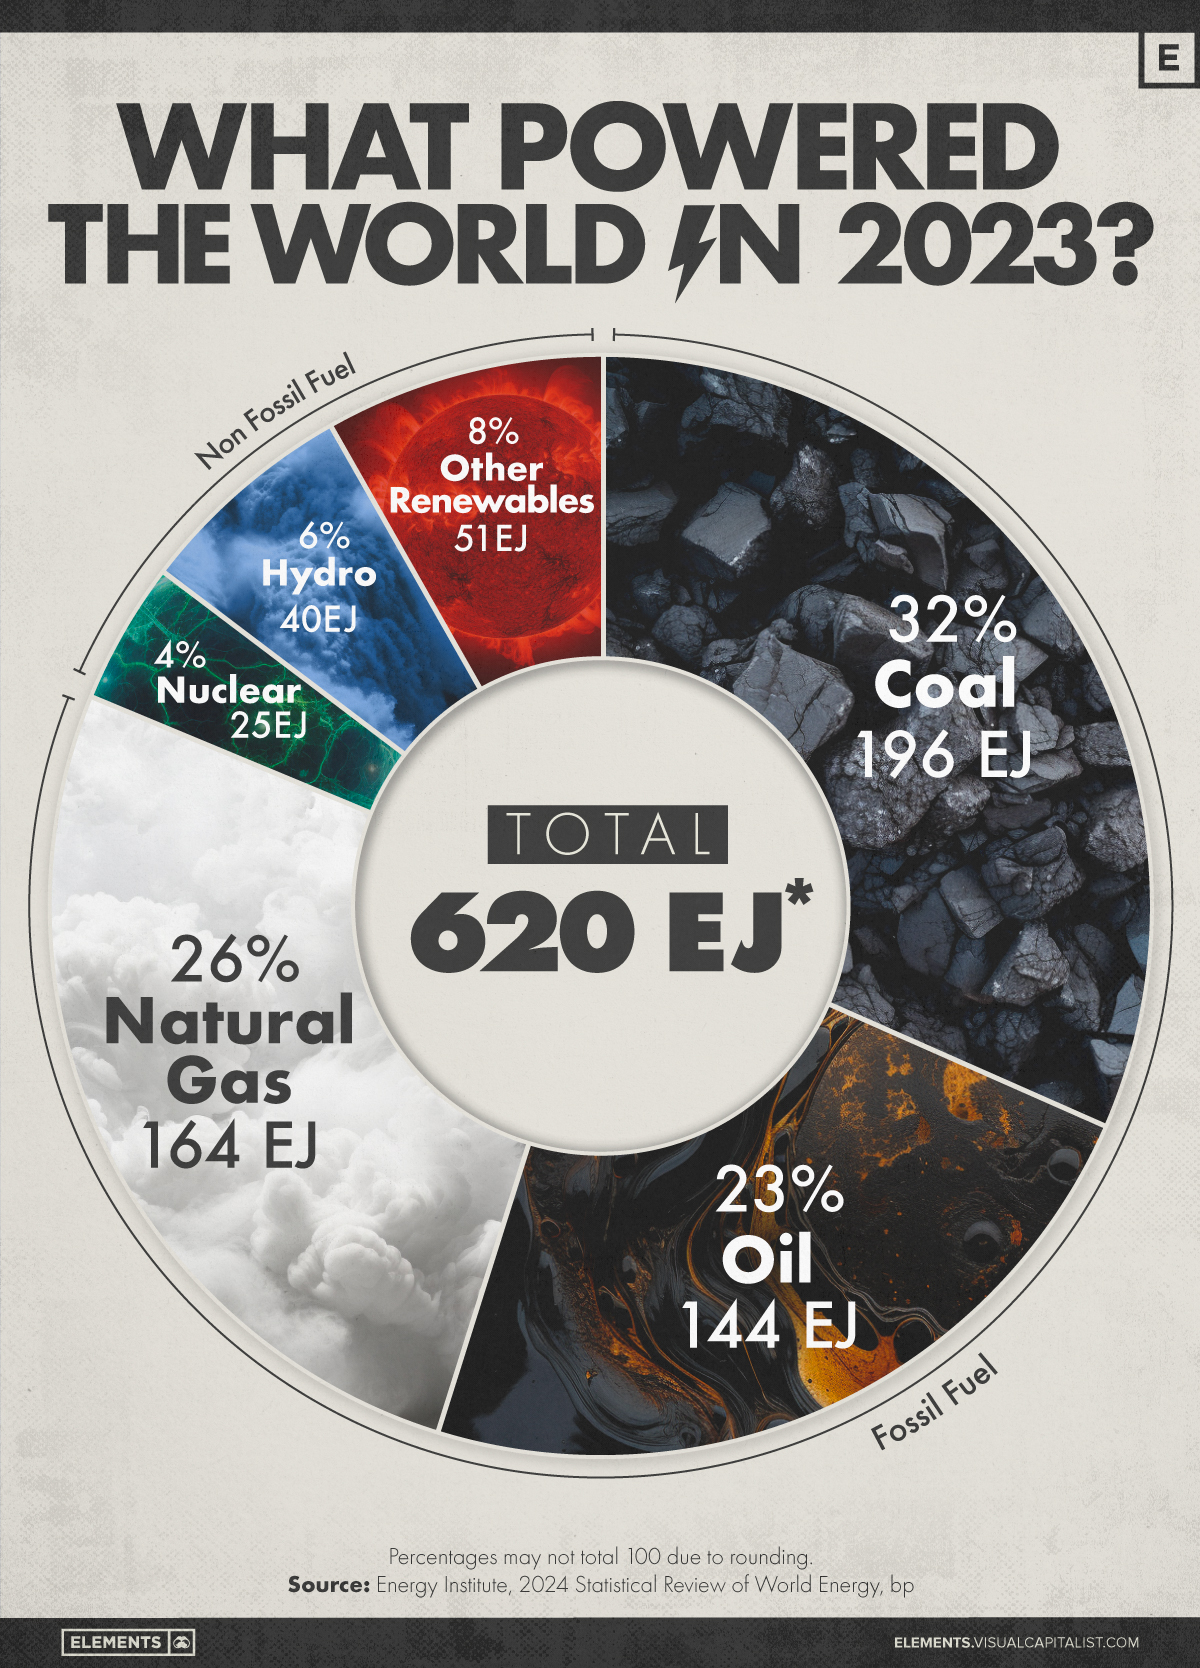
Global primary energy consumption reached a new record of 620 exajoules (EJ) for the second consecutive year in 2023, up from 607 exajoules in 2022.
This graphic shows the sources of energy used globally in 2023, measured in exajoules. Data is from the 2024 Statistical Review of World Energy by the Energy Institute, released in June 2024.
Fossil Fuels Accounted for 81% of the Energy Mix
Despite efforts to decarbonize the economy, fossil fuels still accounted for over 80% of the global energy mix in 2023.
Coal was responsible for 32% of the energy consumed around the world, followed by natural gas (26%) and then oil (23%).
| Energy Source | Consumption in exajoules (EJ) | Percentage (%) | Fossil Fuel |
|---|---|---|---|
| Coal | 196 | 32% | Yes |
| Natural Gas | 164 | 26% | Yes |
| Oil | 144 | 23% | Yes |
| Hydro-electric | 40 | 6% | No |
| Nuclear Energy | 25 | 4% | No |
| Other Renewables | 51 | 8% | No |
| Total | 620 | 100% |
Global coal production reached a record high of 179 EJ last year, surpassing the previous record set in 2022. The Asia-Pacific region was responsible for nearly 80% of global coal output, with significant contributions from Australia, China, India, and Indonesia.
Global coal consumption also continued to rise, exceeding 164 EJ for the first time ever.
China remains the largest consumer of coal, accounting for 56% of the world’s total consumption. However, in 2023, India’s coal consumption exceeded the combined total of Europe and North America for the first time.
Oil consumption, in particular, rebounded strongly last year compared to 2022, largely due to China relaxing its zero-COVID lockdown policies.
Renewables’ share of total primary energy consumption reached 14.6%, an increase of 0.4% over the previous year. Together with nuclear, they represented roughly 19% of total primary energy consumption.
Renewables like solar and wind accounted for 8% of the energy generated in 2023, followed by hydroelectric (6%) and nuclear (4%).
The post Visualizing Global Energy Production in 2023 appeared first on Visual Capitalist.