![]()
See this visualization first on the Voronoi app.
Use This Visualization
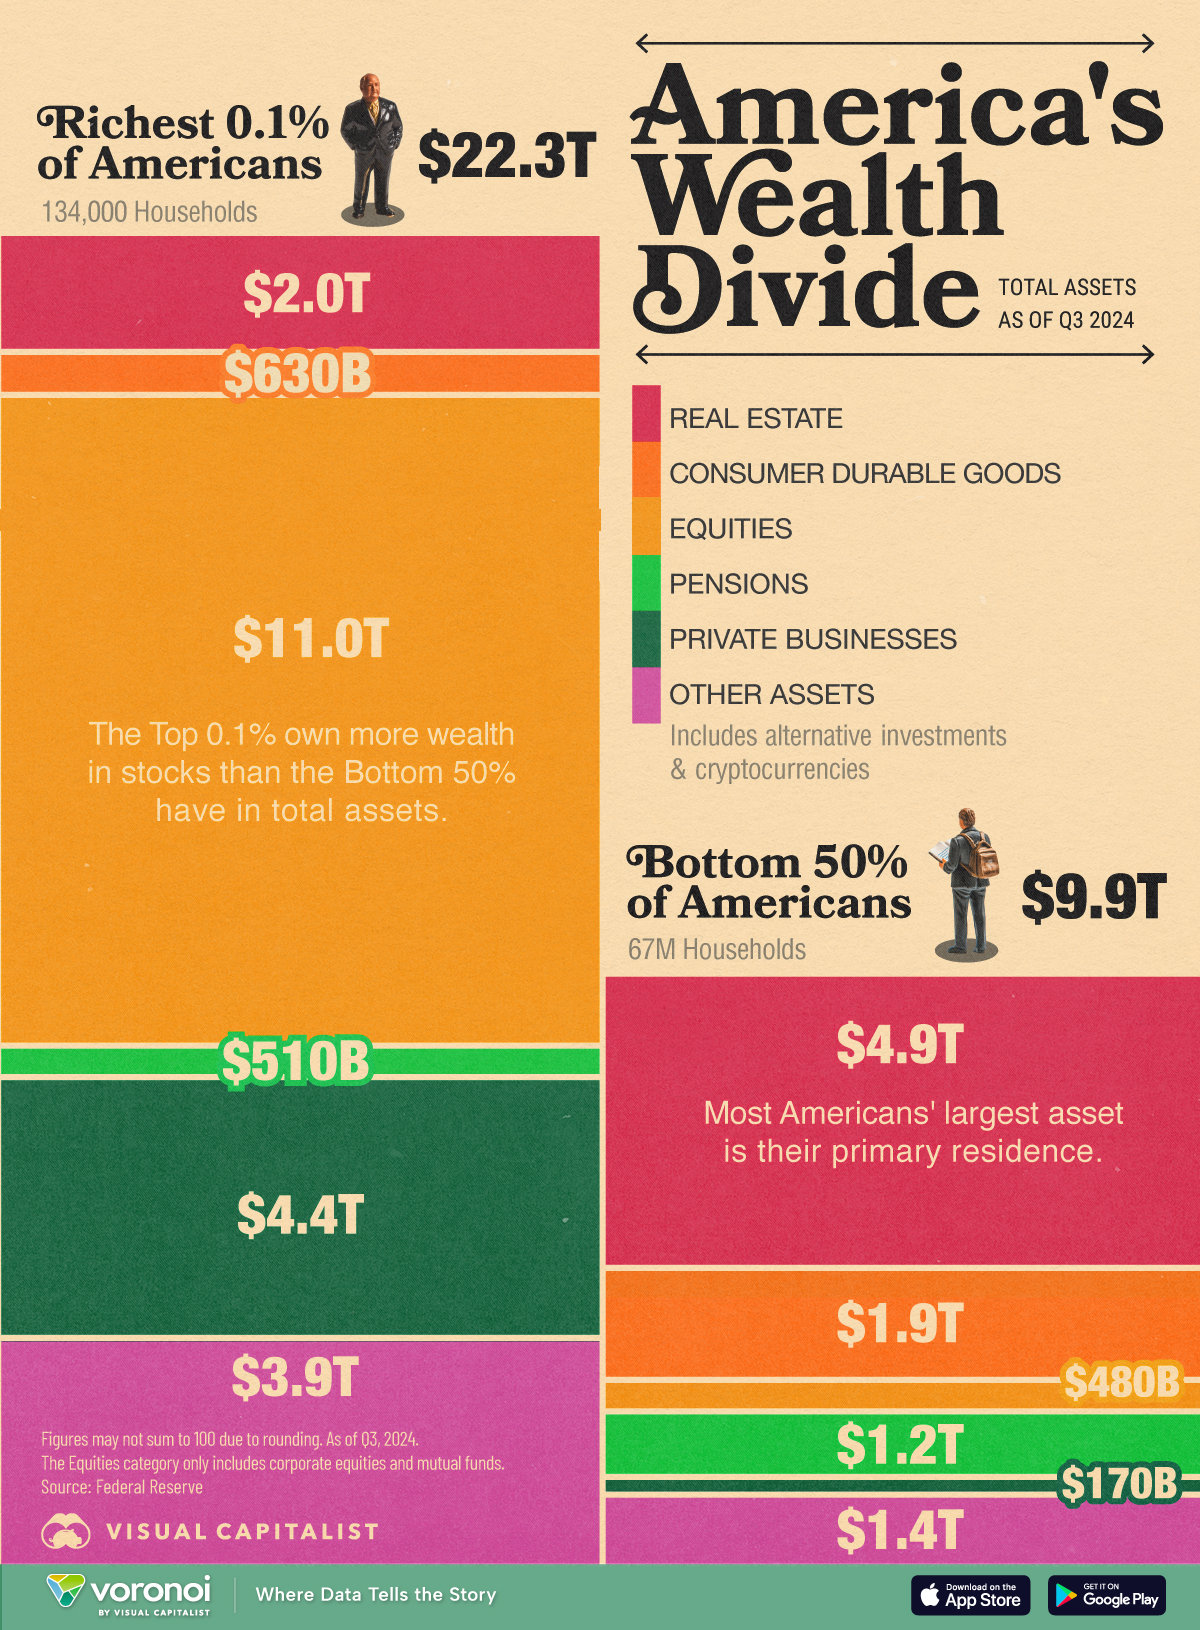
Wealth Asset Breakdown: America’s Top 0.1% vs. Bottom 50%
This was originally posted on our Voronoi app. Download the app for free on iOS or Android and discover incredible data-driven charts from a variety of trusted sources.
Key Takeaways
- America’s Richest 0.1% (134,000 households) own $11 trillion in equities, their largest asset class.
- This is worth more than the total combined wealth assets of the bottom 50% (66.6 million households).
- The bottom 50%’s largest category of wealth is real estate, most likely their primary homes.
It’s no secret that America’s wealth inequality is increasing. The richest Americans now own nearly a full-third of the country’s total wealth.
And within that select group, the top 0.1% own nearly 15% of America’s wealth. This is compared to the around 3% held by the entire bottom 50%.
But where exactly is this wealth parked? We visualize the asset breakdown for the top 0.1% and compare it to the bottom 50% with data from the Federal Reserve, current to Q3, 2024.
The Top 0.1% Prefer Equities Over Everything Else
The massive difference in assets owned is perhaps the biggest single takeaway from this chart.
| Category | Top 0.1% Wealth Assets |
Share of Total Assets (Top 0.1%) |
Bottom 50% Wealth Assets |
Share of Total Assets (Bottom 50%) |
|---|---|---|---|---|
| Real estate | $2.0T | 9% | $4.9T | 49% |
| Consumer durables | $0.6T | 3% | $1.9T | 19% |
| Equities | $11.0T | 49% | $0.5T | 5% |
| Pensions | $0.5T | 2% | $1.2T | 12% |
| Private businesses | $4.4T | 20% | $0.2T | 2% |
| Other assets | $3.9T | 17% | $1.4T | 14% |
| Total | $22.3T | NA | $9.9T | NA |
Note: This data represents wealth assets only, and doesn’t account for debt.
For example, America’s richest 0.1% (134,000 households) own $11 trillion in equities, their largest asset class.
This is worth more than the total combined wealth assets of the bottom 50% (66.6 million households).
Meanwhile, the bottom 50%’s largest category of wealth is real estate, most likely their primary homes.
It’s also interesting to see that the super-rich’s wealth is mostly liquid: where stock can be sold and converted to cash easily.
However the bottom 50% percent’s wealth is mostly in housing and durable goods (like cars) which are far harder to sell.
Learn More on the Voronoi App ![]()
How do America’s wealthiest contribute to the social security net? Check out: Income Tax by Wealth Bracket for a quick overview.
The post Wealth Asset Breakdown: America’s Top 0.1% vs. Bottom 50% appeared first on Visual Capitalist.