Subscribe to the Elements free mailing list for more like this
The History of Energy Transitions
This was originally posted on Elements. Sign up to the free mailing list to get beautiful visualizations on natural resource megatrends in your email every week.
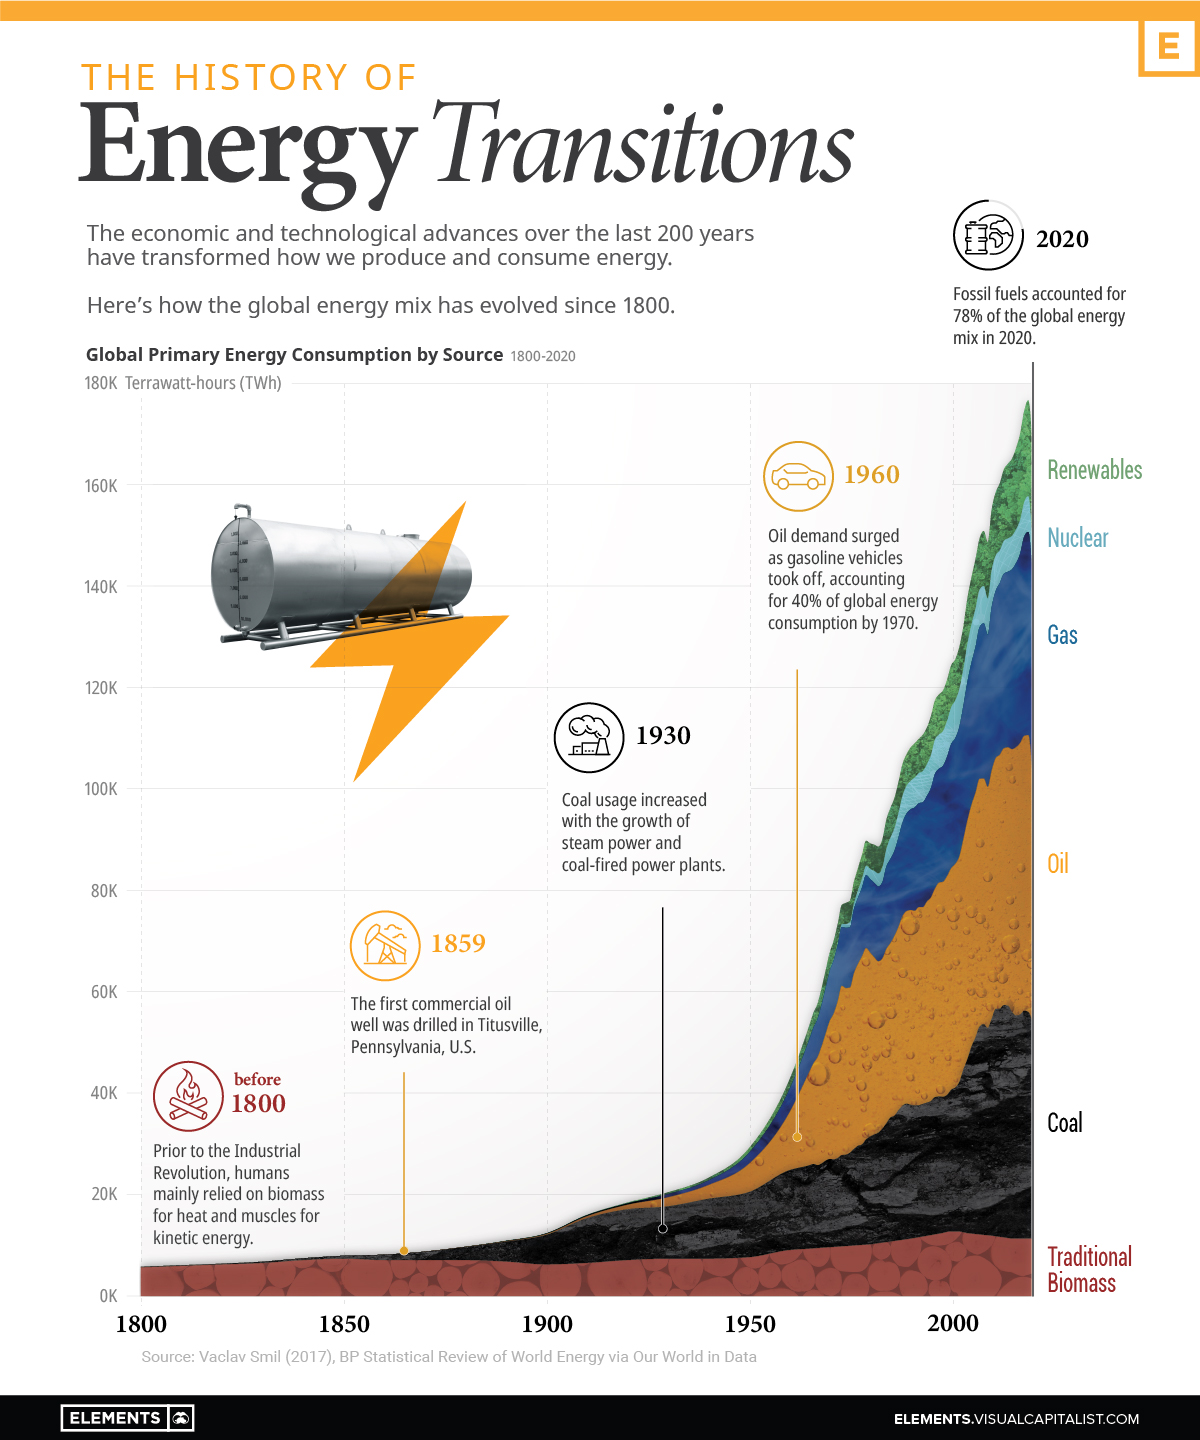
Over the last 200 years, how we’ve gotten our energy has changed drastically.
These changes were driven by innovations like the steam engine, oil lamps, internal combustion engines, and the wide-scale use of electricity. The shift from a primarily agrarian global economy to an industrial one called for new sources to provide more efficient energy inputs.
The current energy transition is powered by the realization that avoiding the catastrophic effects of climate change requires a reduction in greenhouse gas emissions. This infographic provides historical context for the ongoing shift away from fossil fuels using data from Our World in Data and scientist Vaclav Smil.
Coal and the First Energy Transition
Before the Industrial Revolution, people burned wood and dried manure to heat homes and cook food, while relying on muscle power, wind, and water mills to grind grains. Transportation was aided by using carts driven by horses or other animals.
In the 16th and 17th centuries, the prices of firewood and charcoal skyrocketed due to shortages. These were driven by increased consumption from both households and industries as economies grew and became more sophisticated.
Consequently, industrializing economies like the UK needed a new, cheaper source of energy. They turned to coal, marking the beginning of the first major energy transition.
| Year | Traditional Biomass % of Energy Mix | Coal % of Energy Mix |
|---|---|---|
| 1800 | 98.3% | 1.7% |
| 1820 | 97.6% | 2.4% |
| 1840 | 95.1% | 4.9% |
| 1860 | 86.8% | 13.3% |
| 1880 | 73.0% | 26.7% |
| 1900 | 50.4% | 47.2% |
| 1920 | 38.4% | 54.4% |
| 1940 | 31.6% | 50.7% |
As coal use and production increased, the cost of producing it fell due to economies of scale. Simultaneously, technological advances and adaptations brought about new ways to use coal.
The steam engine—one of the major technologies behind the Industrial Revolution—was heavily reliant on coal, and homeowners used coal to heat their homes and cook food. This is evident in the growth of coal’s share of the global energy mix, up from 1.7% in 1800 to 47.2% in 1900.
The Rise of Oil and Gas
In 1859, Edwin L. Drake built the first commercial oil well in Pennsylvania, but it was nearly a century later that oil became a major energy source.
Before the mass production of automobiles, oil was mainly used for lamps. Oil demand from internal combustion engine vehicles started climbing after the introduction of assembly lines, and it took off after World War II as vehicle purchases soared.
Similarly, the invention of the Bunsen burner opened up new opportunities to use natural gas in households. As pipelines came into place, gas became a major source of energy for home heating, cooking, water heaters, and other appliances.
| Year | Coal % of Energy Mix | Oil % of Energy Mix | Natural Gas % of Energy Mix |
|---|---|---|---|
| 1950 | 44.2% | 19.1% | 7.3% |
| 1960 | 37.0% | 26.6% | 10.7% |
| 1970 | 25.7% | 40.2% | 14.5% |
| 1980 | 23.8% | 40.6% | 16.3% |
| 1990 | 24.4% | 35.5% | 18.4% |
| 2000 | 22.5% | 35.1% | 19.7% |
Coal lost the home heating market to gas and electricity, and the transportation market to oil.
Despite this, it became the world’s most important source of electricity generation and still accounts for over one-third of global electricity production today.
The Transition to Renewable Energy
Renewable energy sources are at the center of the ongoing energy transition. As countries ramp up their efforts to curb emissions, solar and wind energy capacities are expanding globally.
Here’s how the share of renewables in the global energy mix changed over the last two decades:
| Year | Traditional Biomass | Renewables | Fossil Fuels | Nuclear Power |
|---|---|---|---|---|
| 2000 | 10.2% | 6.6% | 77.3% | 5.9% |
| 2005 | 8.7% | 6.5% | 79.4% | 5.4% |
| 2010 | 7.7% | 7.7% | 79.9% | 4.7% |
| 2015 | 6.9% | 9.2% | 79.9% | 4.0% |
| 2020 | 6.7% | 11.2% | 78.0% | 4.0% |
In the decade between 2000 and 2010, the share of renewables increased by just 1.1%. But the growth is speeding up—between 2010 and 2020, this figure stood at 3.5%.
Furthermore, the current energy transition is unprecedented in both scale and speed, with climate goals requiring net-zero emissions by 2050. That essentially means a complete fade-out of fossil fuels in less than 30 years and an inevitable rapid increase in renewable energy generation.
Renewable energy capacity additions were on track to set an annual record in 2021, following a record year in 2020. Additionally, global energy transition investment hit a record of $755 billion in 2021.
However, history shows that simply adding generation capacity is not enough to facilitate an energy transition. Coal required mines, canals, and railroads; oil required wells, pipelines, and refineries; electricity required generators and an intricate grid.
Similarly, a complete shift to low-carbon sources requires massive investments in natural resources, infrastructure, and grid storage, along with changes in our energy consumption habits.
The post Visualizing the History of Energy Transitions appeared first on Visual Capitalist.