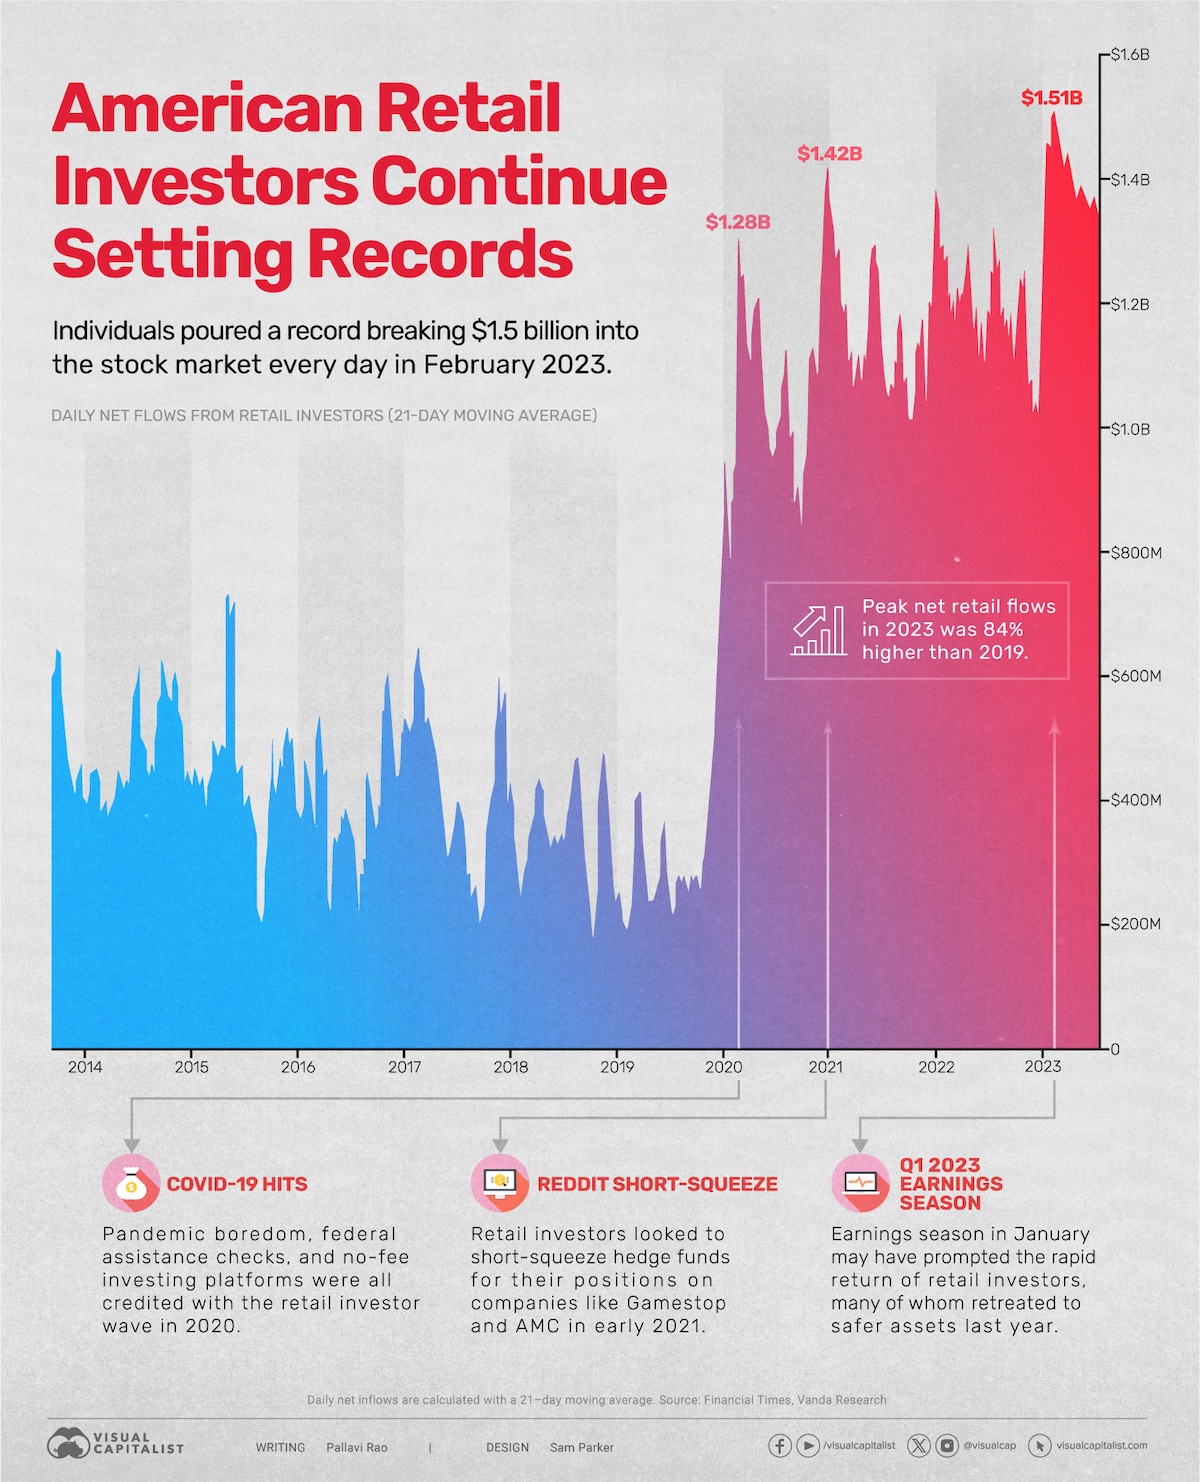
Charted: U.S. Retail Investor Inflows (2014–2023)
U.S. retail investor sentiment hit a record breaking high at the start of 2023, buoyed by the sudden progress in AI capabilities.
Seen as a side show in the stock market for much of the last decade, retail investors are now an investing juggernaut to be considered with.
But how did they get there?
We look at data from Vanda Research, which tracks the daily net flows from U.S. retail investors (calculated using a 21-day moving average) between 2014 and 2023, visualized in the chart above.
Net Inflows from U.S. Retail Investors Break Records
Between 2014–2019, daily U.S. retail investor flows stayed range-bound, occasionally dipping below $200 million and peaking at around $700 million in 2015.
However, a series of factors propelled retail investors to new heights at the end of 2019.
No-fee investing platforms, along with pandemic-induced boredom from lockdowns, combined with federal assistance checks sent investors scurrying to the markets. By the first quarter of 2020, daily net flows hit $1.28 billion, nearly double the previous high in 2015.
| Year | Peak Daily Retail Flows |
|---|---|
| 2014 | $620M |
| 2015 | $730M |
| 2016 | $605M |
| 2017 | $640M |
| 2018 | $480M |
| 2019 | $820M |
| 2020 | $1.28B |
| 2021 | $1.42B |
| 2022 | $1.32B |
| 2023 | $1.51B |
Sentiment—and flows—trended downwards for the rest of 2020, but in 2021, courtesy of the r/wallstreetbets inspired hedge fund short-squeeze, daily flows hit $1.48 billion, as investors piled into video game retailer GameStop.
For the next two years flows stayed locked between $1-1.4 billion per day, as inflation reared its head and bond yields began to climb.
However, in the first few months of 2023, coinciding with Q1 earnings season, U.S. retail investors came roaring back, this time shattering yet another milestone, with daily net flows crossing $1.5 billion a day in February—yet another all-time high.
And instead of going for battered-down childhood nostalgia companies, this time the retail army snapped up several tech picks, like Apple, Amazon and Nvidia, as well as dividend-paying Coca-Cola and AT&T.
Are U.S. Retail Investors Here to Stay?
Part of what is sending retail investor flows up on average is how many more Americans have been involved in the stock market in the last four years.
After the 2008 recession, American stock ownership trended downwards with about 55% investing in the market between 2009–2019.
| Time Period | Average American Stock Ownership |
|---|---|
| 1998–2008 | 61% |
| 2009–2019 | 55% |
| 2020–2023 | 58% |
Source: Gallup poll.
This was less than both the previous decade (61%) and the beginning of the new decade, (58%).
And while a fair amount of younger investors came aboard the coordinated short-squeeze effort in 2021, many have stayed invested, diversifying their portfolios and aiming for long-term gains.
Where Does This Data Come From?
Sources: Vanda Research’s insights, published in the Financial Times and Gallup’s survey on American stock ownership.
Note: In the Gallup poll, surveyors were asked: “Do you, personally, or jointly with a spouse, have any money invested in the stock market right now—either in an individual stock, a stock mutual fund, or in a self-directed 401(k) or IRA?”
The post Charted: U.S. Retail Investor Inflows (2014–2023) appeared first on Visual Capitalist.