![]()
See this visualization first on the Voronoi app.
Use This Visualization
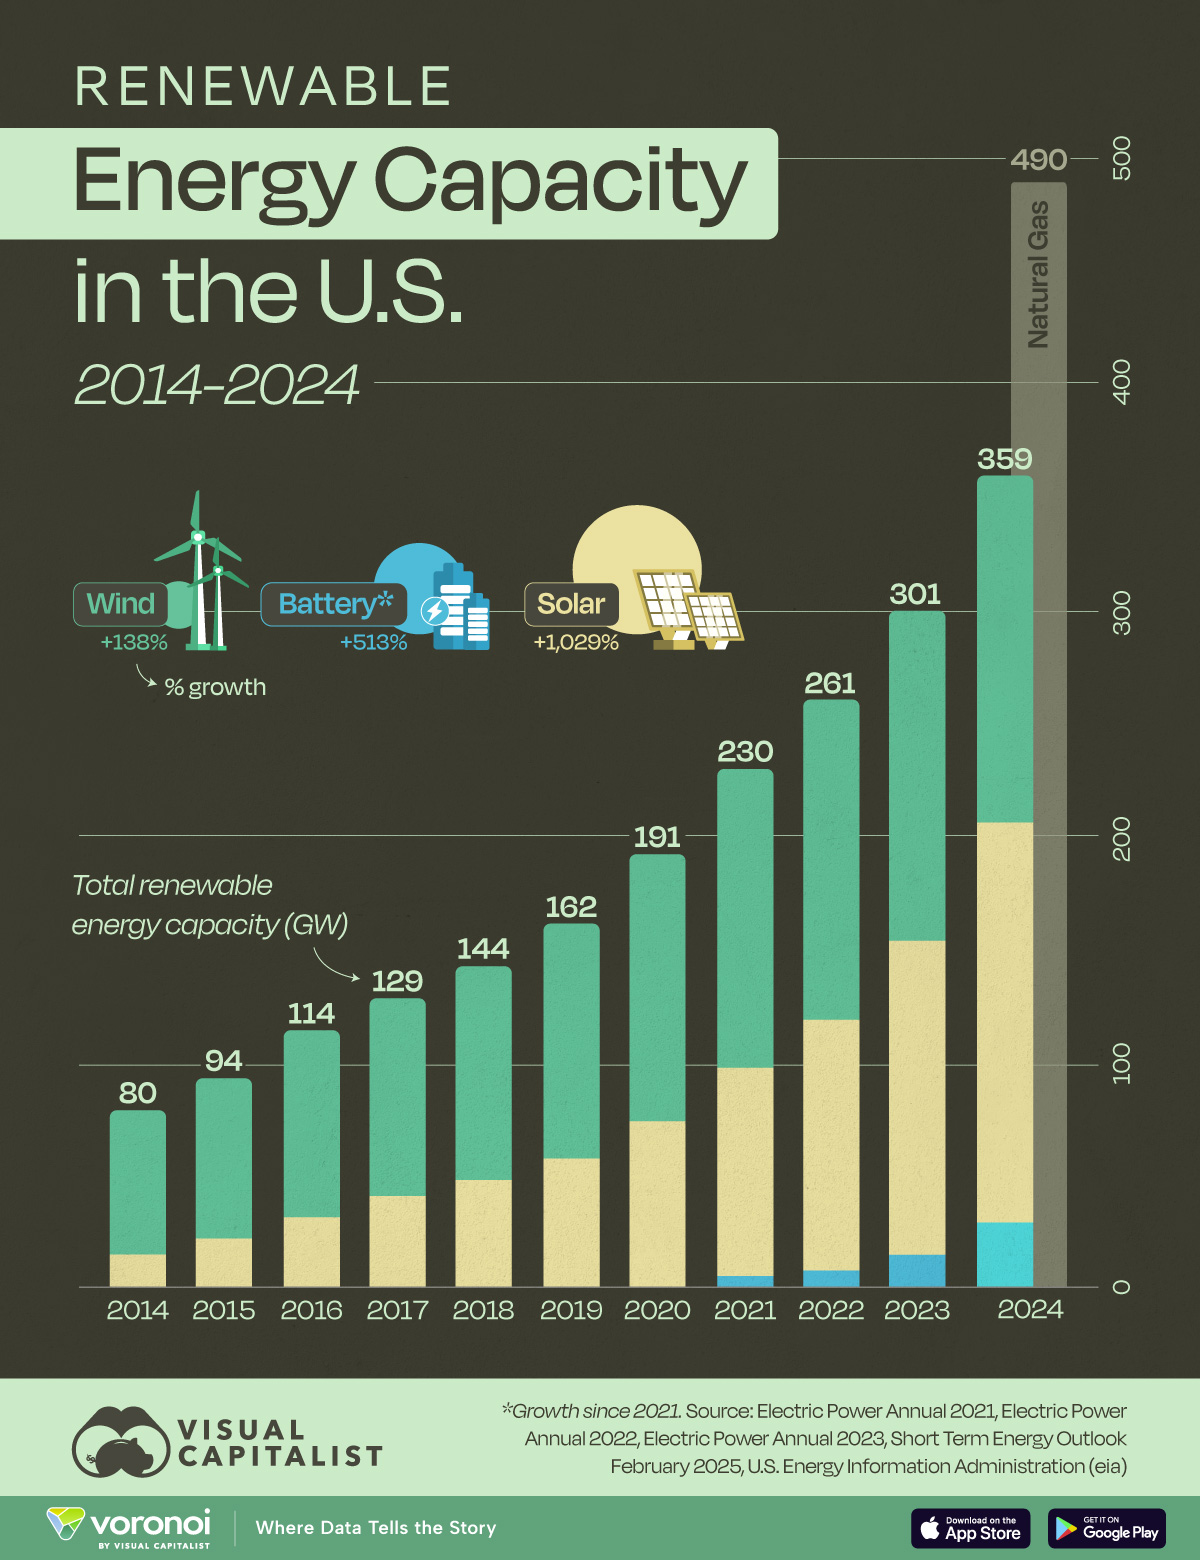
Charted: Renewable Energy Capacity in the U.S. (2014-2024)
This was originally posted on our Voronoi app. Download the app for free on iOS or Android and discover incredible data-driven charts from a variety of trusted sources.
Key Takeaways
- Renewable energy capacity in the U.S. has surged over the past decade, driven by falling costs, policy support, and rising demand
- Solar and wind now account for a growing share of the energy mix, outpacing coal and closing in on natural gas.
.key-takeaways {
background: #F8F9FA;
border-left: 4px solid #2A6338;
padding: 15px;
margin: 20px 0;
border-radius: 5px;
}
.key-takeaways h3 {
margin-top: 0;
color: #2A6338;
font-weight: bold;
}
.key-takeaways ul {
padding-left: 20px;
}
.key-takeaways li {
margin-bottom: 5px;
}
This graphic visualizes the past 10 years of renewable energy capacity in the U.S., based on data compiled by the World Resources Institute (WRI).
In short, 2024 was a record-breaking year for new installations. 39.4 GW (gigawatts) of solar capacity were added, up from 27.4 GW in 2023.
Another fast-growing category is battery storage, which nearly doubled in 2024. Greater storage capacity is expected to make America’s power system more stable and secure.
Data and Highlights
The data we used to create this graphic is listed in the table below.
| Year | Battery Storage (GW) |
Solar (GW) | Wind (GW) | Total (GW) |
|---|---|---|---|---|
| 2014 | 0 | 15.7 | 64.2 | 80 |
| 2015 | 0 | 21.4 | 72.5 | 94 |
| 2016 | 0 | 32.7 | 81.2 | 114 |
| 2017 | 0 | 41.0 | 87.5 | 129 |
| 2018 | 0 | 49.2 | 94.3 | 144 |
| 2019 | 0 | 58.5 | 103.5 | 162 |
| 2020 | 0 | 73.4 | 118.0 | 191 |
| 2021 | 4.7 | 92.6 | 132.6 | 230 |
| 2022 | 9.0 | 110.6 | 141.3 | 261 |
| 2023 | 16.0 | 137.6 | 147.3 | 301 |
| 2024 | 28.8 | 177.2 | 152.9 | 359 |
Over this 10-year period, solar capacity has grown by 1,029%, battery storage by 513% (since 2021), and wind capacity by 138%.
The WRI reports that growth in wind capacity is slowing due to challenges related to supply chains, financing, and permits.
Solar is Surging
It’s clear from this chart that solar energy is driving the majority of renewable energy growth.
That’s because solar panels have become incredibly cheap over time. As visualized by Our World in Data, the cost of solar panels (measured in dollars per watt) has dropped from over $100 in 1975 to just a few cents in 2022.
This dramatic fall in costs was a major reason for the closure of the Ivanpah solar plant, which relied on the once-promising technology of thermal solar.
Fossil Fuels Are Still #1
Fossil fuels are still the biggest source of U.S. electricity, but the race is getting close.
Research from the Rhodium Group suggests that in 2024, solar and wind produced more power than coal in the U.S. for the first time ever.
Learn More on the Voronoi App ![]()
If you enjoyed this post, check out this graphic that shows China’s soaring electricity output.
The post Charted: Renewable Energy Capacity in the U.S. (2014-2024) appeared first on Visual Capitalist.