![]()
See this visualization first on the Voronoi app.
Use This Visualization
Charted: U.S. Employment by Industry in 2025
This was originally posted on our Voronoi app. Download the app for free on iOS or Android and discover incredible data-driven charts from a variety of trusted sources.
The U.S. comprises many industries that contribute to the economy by producing goods and services, as well as through employment creation.
Generally, the economic contribution of an industry tends to be positively correlated with the number of jobs it creates.
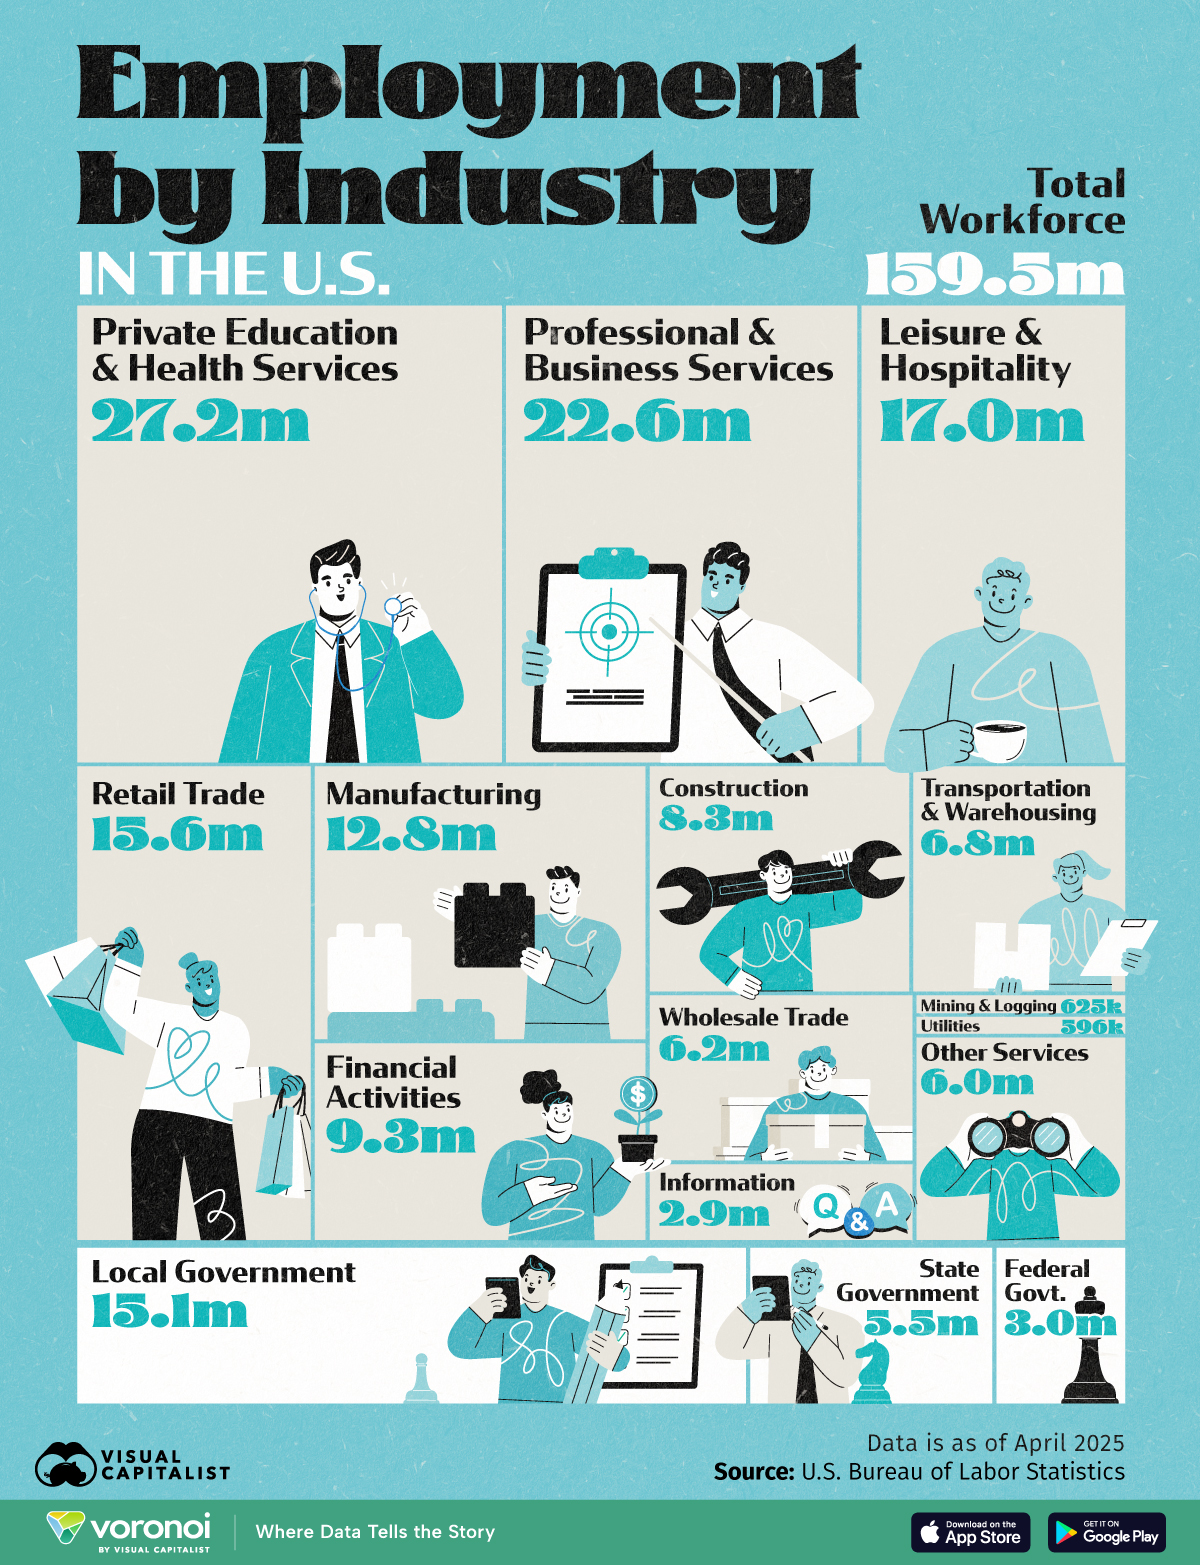
This infographic breaks down U.S. employment by industry in 2025, highlighting the sectors with the most employees. The data is from the Bureau of Labor Statistics, as of April 2025.
The U.S. Industries With the Most Employees
The U.S. is largely a service-based economy. Consequently, a large majority of the country’s 160 million non-farm workers are employed in service-based industries.
Here’s how employment in the U.S. breaks down by industry in 2025:
| Industry | Number of Employees | % of Total |
|---|---|---|
| Private education and health services | 27.2M | 17.1% |
| Professional and business services | 22.6M | 14.2% |
| Leisure and hospitality | 17.0M | 10.7% |
| Retail trade | 15.6M | 9.8% |
| Local government | 15.1M | 9.5% |
| Manufacturing | 12.8M | 8.0% |
| Financial activities | 9.3M | 5.8% |
| Construction | 8.3M | 5.2% |
| Transportation and warehousing | 6.8M | 4.3% |
| Wholesale trade | 6.2M | 3.9% |
| Other services | 6.0M | 3.8% |
| State government | 5.5M | 3.5% |
| Federal government | 3.0M | 1.9% |
| Information | 2.9M | 1.8% |
| Mining and logging | 625K | 0.4% |
| Utilities | 596K | 0.4% |
| Total Non-farm Employees | 159.5M | 100% |
The private education and health services sector leads, employing over 27 million workers or 17% of the country’s workforce.
The professional and business services industry follows closely with nearly 23 million employees. This broad sector covers various jobs, including lawyers, accountants, consultants, designers, and administrative roles.
Other service-based industries with large workforces include leisure and hospitality, and retail trade, both with over 15 million employees. The utilities sector is the smallest service-providing industry by employment, but pays the most across all industries.
Overall, services-providing industries account for more than 70% of the U.S. non-farm workforce.
Meanwhile, the manufacturing industry is the biggest goods-producing industry by employment, followed by construction and mining. Together, these three industries make up around 14% of U.S. non-farm employment.
The U.S. Government is also a major employer, with nearly 24 million employees across the federal, state, and local governments. However, local governments account for the bulk of the government’s workforce, employing around 15 million people.
The State of Employment in the U.S.
The U.S. maintains a healthy employment-to-population ratio of around 60%, although the unemployment rate has been slowly rising in recent years.
Since hitting a cyclical low of 3.4% in January 2023, the U.S. unemployment rate had risen to 4.2% in April 2025, despite the addition of 177,000 non-farm employees over the month. Furthermore, over 23% of all unemployed workers had been out of a job for 6 months or longer in April amidst the overall slowdown in economic growth.
Learn More on the Voronoi App ![]()
If you liked this infographic, check out The 50 Best Places to Work in America, on the Voronoi app.