![]()
See more visuals like this on the Voronoi app.
Use This Visualization
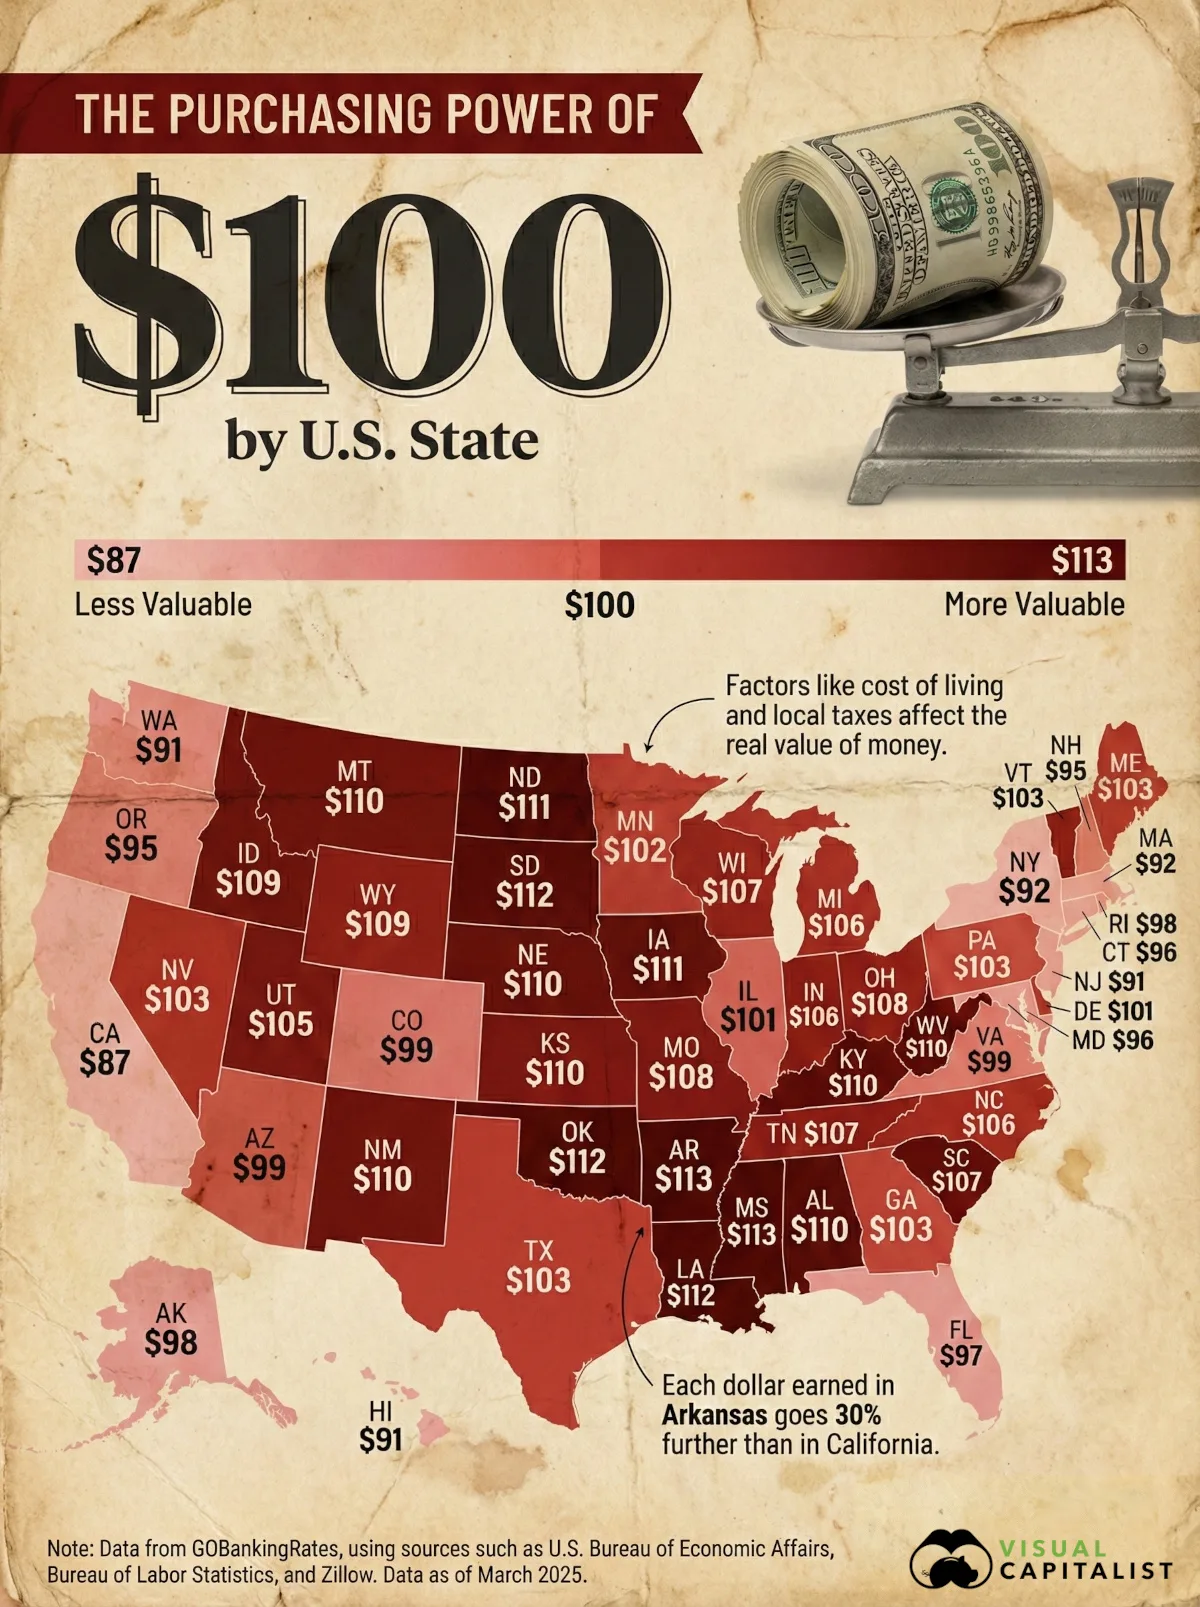
Mapped: The Real Purchasing Power of $100 by U.S. State
See visuals like this from many other data creators on our Voronoi app. Download it for free on iOS or Android and discover incredible data-driven charts from a variety of trusted sources.
Key Takeaways
- The same amount of cash goes 30% further in Arkansas than it does in California.
- By looking at the real purchasing power of $100, we can get a sense of how cost of living varies between U.S. states.
Is a dollar in your pocket the same in Albuquerque as it is in New York City?
The face value may be the same, but in reality that dollar just goes further in certain metro areas and states.
Today’s visualization shows the relative value of $100 in each U.S. state. It’s based on data from GOBankingRates, which uses publicly available federal datasets such as those from the U.S. Bureau of Labor Statistics, the U.S. Bureau of Economic Affairs, and the U.S. Census American Consumer Survey to do the calculations.
The Data: State-by-State Purchasing Power
Below you’ll see how far $100 goes in each state.
Included in the dataset is typical home value and annual cost of living to help provide context:
| Rank | State | Real Value of $100 | Typical Home Value | Annual Cost of Living |
|---|---|---|---|---|
| 1 | Arkansas | $113.49 | $208,734 | $37,067 |
| 2 | Mississippi | $112.71 | $176,933 | $35,580 |
| 3 | South Dakota | $111.91 | $302,023 | $44,923 |
| 4 | Oklahoma | $111.71 | $205,311 | $37,697 |
| 5 | Louisiana | $111.66 | $198,094 | $36,860 |
| 6 | North Dakota | $111.43 | $268,912 | $42,925 |
| 7 | Iowa | $111.23 | $218,773 | $39,069 |
| 8 | West Virginia | $110.23 | $163,193 | $35,206 |
| 9 | Kansas | $110.04 | $225,396 | $39,073 |
| 10 | Alabama | $110.03 | $222,475 | $38,712 |
| 11 | Montana | $109.76 | $450,056 | $56,763 |
| 12 | Nebraska | $109.62 | $257,397 | $42,019 |
| 13 | New Mexico | $109.61 | $302,570 | $55,579 |
| 14 | Kentucky | $109.53 | $208,745 | $38,817 |
| 15 | Wyoming | $109.15 | $349,235 | $48,609 |
| 16 | Idaho | $108.58 | $452,207 | $56,438 |
| 17 | Missouri | $108.24 | $246,692 | $40,318 |
| 18 | Ohio | $108.19 | $229,027 | $40,062 |
| 19 | Indiana | $107.82 | $238,281 | $40,548 |
| 20 | Tennessee | $107.49 | $318,006 | $44,868 |
| 21 | Wisconsin | $106.90 | $307,398 | $46,182 |
| 22 | South Carolina | $106.82 | $296,068 | $44,854 |
| 23 | North Carolina | $105.86 | $328,226 | $47,494 |
| 24 | Michigan | $105.82 | $239,674 | $40,628 |
| 25 | Utah | $105.00 | $528,156 | $61,534 |
| 26 | Vermont | $103.37 | $388,319 | $53,614 |
| 27 | Georgia | $103.30 | $326,933 | $41,159 |
| 28 | Nevada | $103.02 | $458,436 | $57,796 |
| 29 | Maine | $102.90 | $387,588 | $54,032 |
| 30 | Texas | $102.83 | $299,948 | $44,989 |
| 31 | Pennsylvania | $102.50 | $266,221 | $43,345 |
| 32 | Minnesota | $101.58 | $335,238 | $48,347 |
| 33 | Illinois | $101.15 | $270,708 | $43,758 |
| 34 | Delaware | $100.75 | $380,485 | $51,935 |
| 35 | Virginia | $99.25 | $398,259 | $52,734 |
| 36 | Arizona | $98.90 | $433,746 | $55,529 |
| 37 | Colorado | $98.62 | $552,897 | $63,270 |
| 38 | Alaska | $98.29 | $379,622 | $59,801 |
| 39 | Rhode Island | $98.29 | $379,622 | $59,801 |
| 40 | Florida | $96.55 | $404,924 | $53,525 |
| 41 | Connecticut | $96.31 | $429,793 | $57,885 |
| 42 | Maryland | $96.04 | $430,192 | $56,244 |
| 43 | Oregon | $95.28 | $498,760 | $61,654 |
| 44 | New Hampshire | $94.66 | $495,860 | $61,111 |
| 45 | New York | $92.37 | $455,344 | $58,146 |
| 46 | Massachusetts | $91.76 | $642,213 | $75,065 |
| 47 | Washington | $91.44 | $603,927 | $70,164 |
| 48 | Hawaii | $91.39 | $967,396 | $103,371 |
| 49 | New Jersey | $91.12 | $558,134 | $65,337 |
| 50 | California | $87.42 | $793,150 | $86,408 |
In Arkansas, $100 actually goes much further than normal, providing $113.49 of real purchasing power.
In California it’s the opposite case, where a hundred-dollar bill is only really worth $87.42. In the case of California and other expensive states, purchasing power is eroded away by the high cost of living, local taxes, and other factors that prevent you from making the most of your money.
High Income ≠ High Purchasing Power
Here’s one interesting takeaway: many of the highest-income states, such as California, New Jersey, Massachusetts, Hawaii, also rank among the worst for real dollar value.
Massachusetts has a six-figure median income, but $100 only buys $92 worth of goods. Meanwhile, Iowa and Kansas have more modest incomes, but a dollar goes almost 25% further than in an expensive state like Massachusetts.
This shows that higher wages in coastal states are partially or completely eaten by cost of living premiums.
The Affordability Belt
Looking at the map, there is a clear “affordability belt” that can be seen visually.
In the Mountain West, Midwest, and South—including Idaho ($108.58), Montana ($109.76), Louisiana ($111.66), Ohio ($108.19), and West Virginia ($110.23)—each dollar goes a little further.
Learn More on the Voronoi App ![]()
Where are countries losing purchasing power the fastest? See this visualization on the highest inflation rates by country on Voronoi, the app from Visual Capitalist.