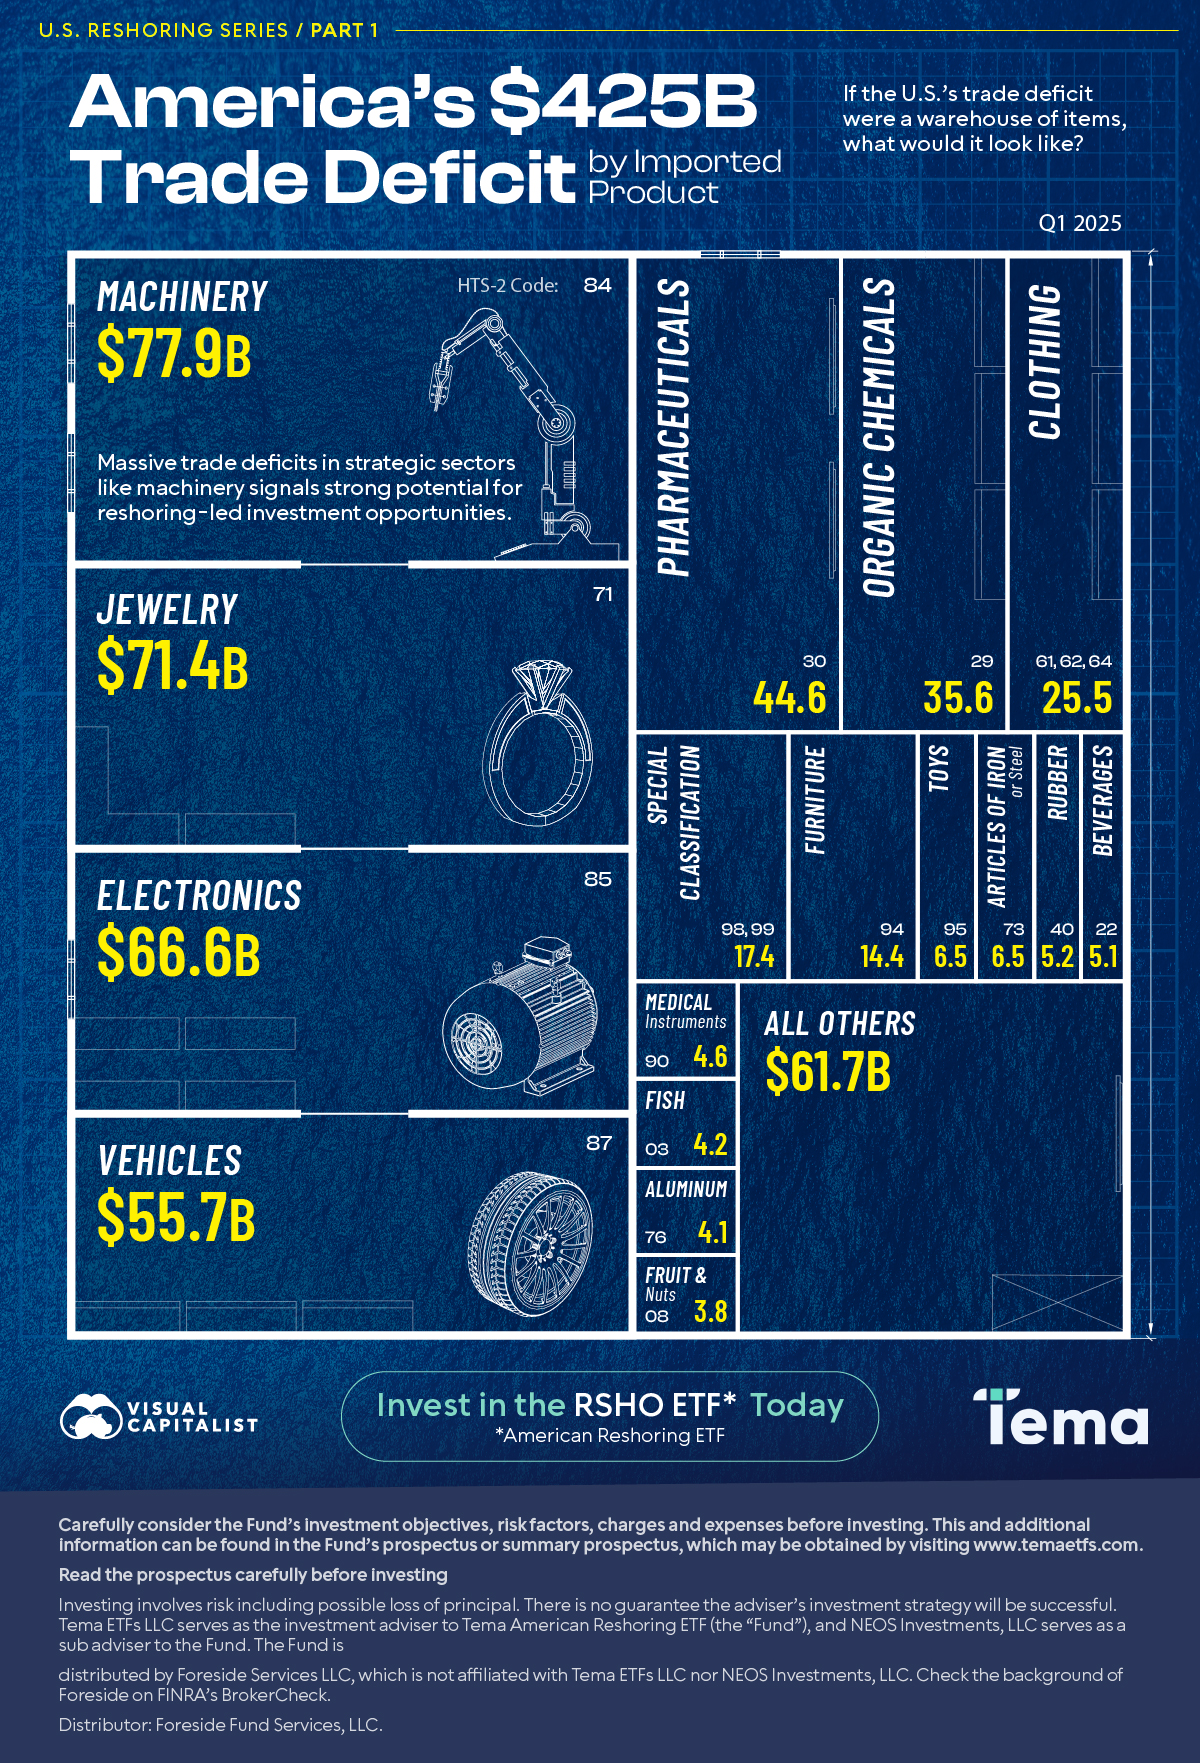
Ranked: America’s $425B Trade Deficit by Product
Published
1 hour ago
on
May 29, 2025
| 19 views
-->
By
Ryan Bellefontaine
Graphics & Design

Published
1 hour ago
on
May 29, 2025
| 19 views
-->
By
Ryan Bellefontaine
Graphics & Design
![]()
See this visualization first on the Voronoi app.
Use This Visualization
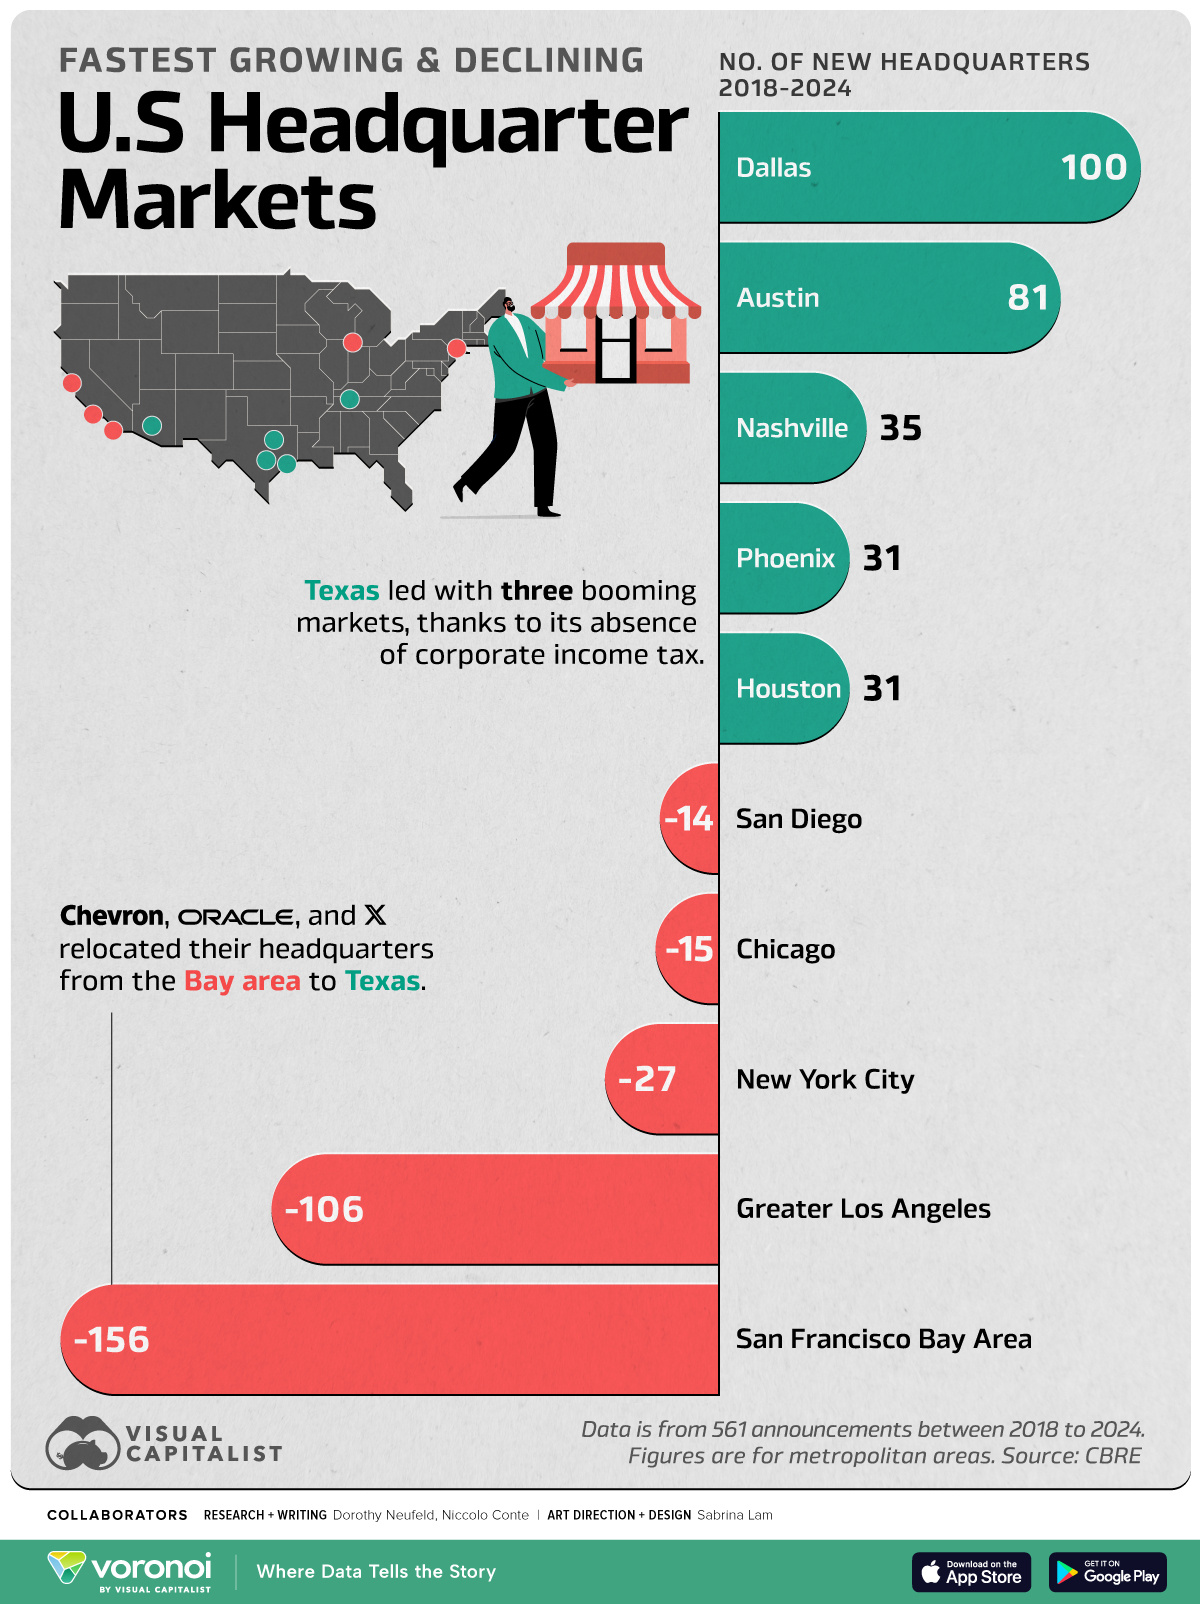
Where Are Companies Moving Their Headquarters To?
This was originally posted on our Voronoi app. Download the app for free on iOS or Android and discover incredible data-driven charts from a variety of trusted sources.
Key Takeaways
Published
6 mins ago
on
May 27, 2025
| 724 views
-->
By
Julia Wendling
Article & Editing
Graphics & Design
![]()
See this visualization first on the Voronoi app.
Use This Visualization
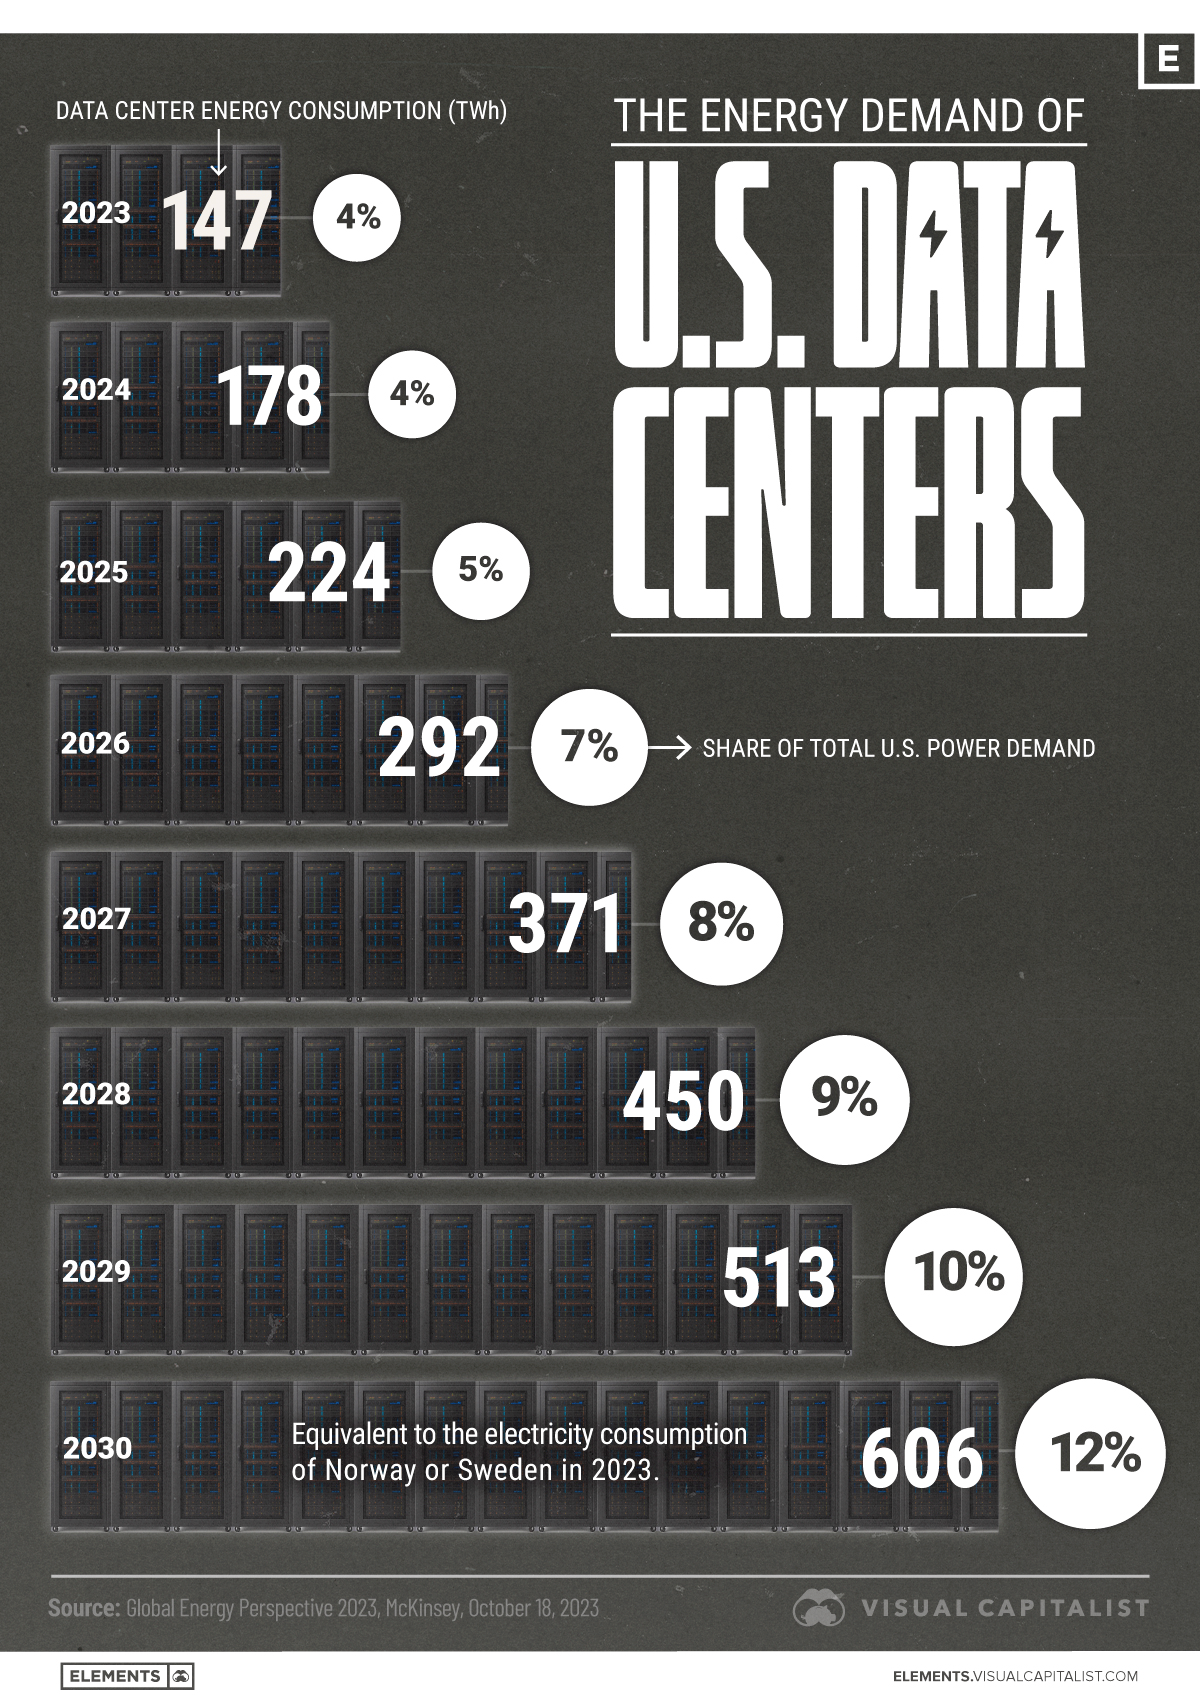
Charted: The Energy Demand of U.S. Data Centers
This was originally posted on our Voronoi app. Download the app for free on iOS or Android and discover incredible data-driven charts from a variety of trusted sources.

Published
34 mins ago
on
May 27, 2025
| 15 views
-->
By
Julia Wendling
Graphics & Design